Hi @alastairrushworth and thanks for this awesome package! I turn to it frequently to get a sense of new datasets.
One point of friction for me is that show_plot() doesn't return the ggplot2 object created by lower-level functions like plot_cat(). Currently, I believe that if type$method == "types" in show_plot() the result will be the ggplot2 object but otherwise, because of the if statements throughout show_plot(), the result will always be NULL.
library(dplyr)
library(inspectdf)
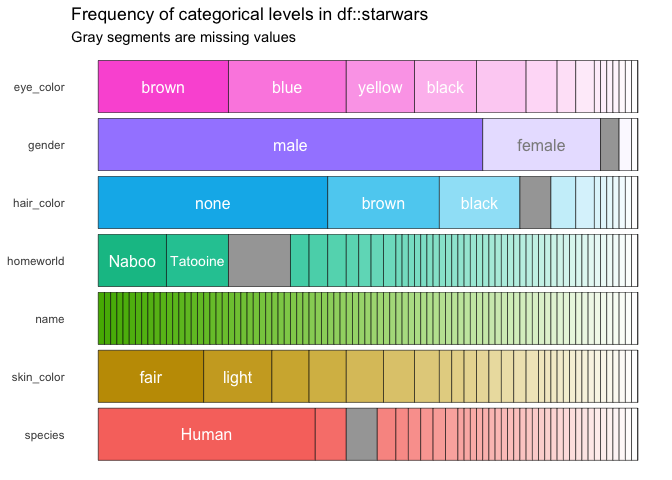
g <- starwars %>%
inspect_cat() %>%
show_plot()
This makes it difficult for users who would like to work with the ggplot2 object, to add or change styles, for example, because they need to fall back to using ::: to access inspectdf:::plot_cat() or similar. Unfortunately for these users, the default values for plot_cat() are handled by show_plot(), further increasing friction.
g2 <- starwars %>%
  inspect_cat() %>%
  inspectdf:::plot_cat()
#> Error in lapply(lvl_df$levels, merge_card, high_cardinality = high_cardinality): argument "high_cardinality" is missing, with no default
If I provide the default values to the lower level functions, then I can gain access to the created ggplot2 object, but it's clear that plot_cat() isn't designed for end user consumption.
g2 <- starwars %>%
  inspect_cat() %>%
  inspectdf:::plot_cat(
    df_names = list(df1 = "starwars"),
    high_cardinality = 10,
    col_palette = 0,
    text_labels = TRUE,
    label_thresh = 0.1
  )
g2
#> Warning: Stacking not well defined when not anchored on the axis

Personally, I would prefer that show_plot() simply return the ggplot2 object and that default printing rules are used to display the plot rather than explicitly calling print() internally. In this way, show_plot() would work as in the last example, but without automatically printing the plot. Doing this would give the user more control over where and how the inspectdf plots are used.
Created on 2019-07-23 by the reprex package (v0.2.1)