🏆 A Telegram Chart Contest 2019 award winning library.
mobile friendly, high performance, extra lightweight, zero dependency, production ready, open source

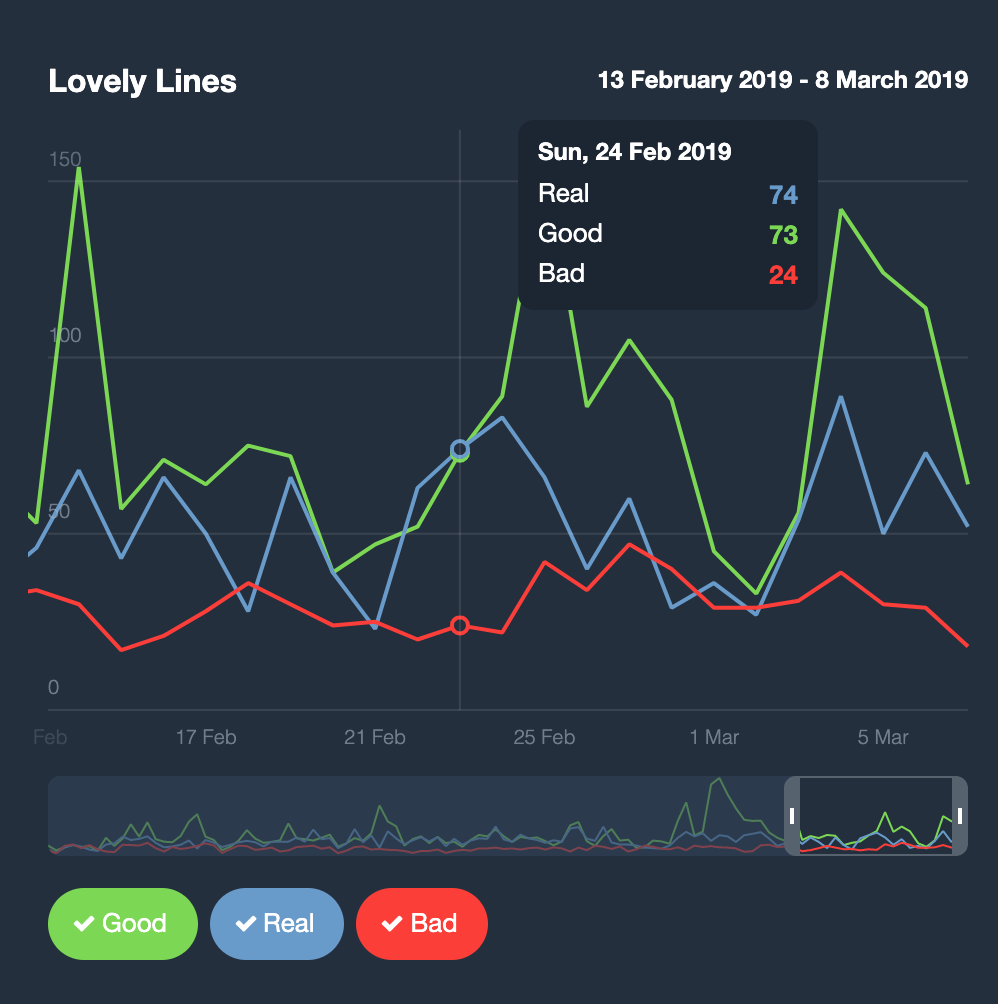
https://ajaxy.github.io/lovely-chart/
import * as LovelyChart from 'lovely-chart';
import '~/lovely-chart/dist/LovelyChart.css';

LovelyChart.create(container, data);container— DOM Node in which the chart is rendered. The chart layout resizes automatically to occupy the entire available width.data— Parameters for a chart.
| Parameter | Description |
|---|---|
title |
Chart headline |
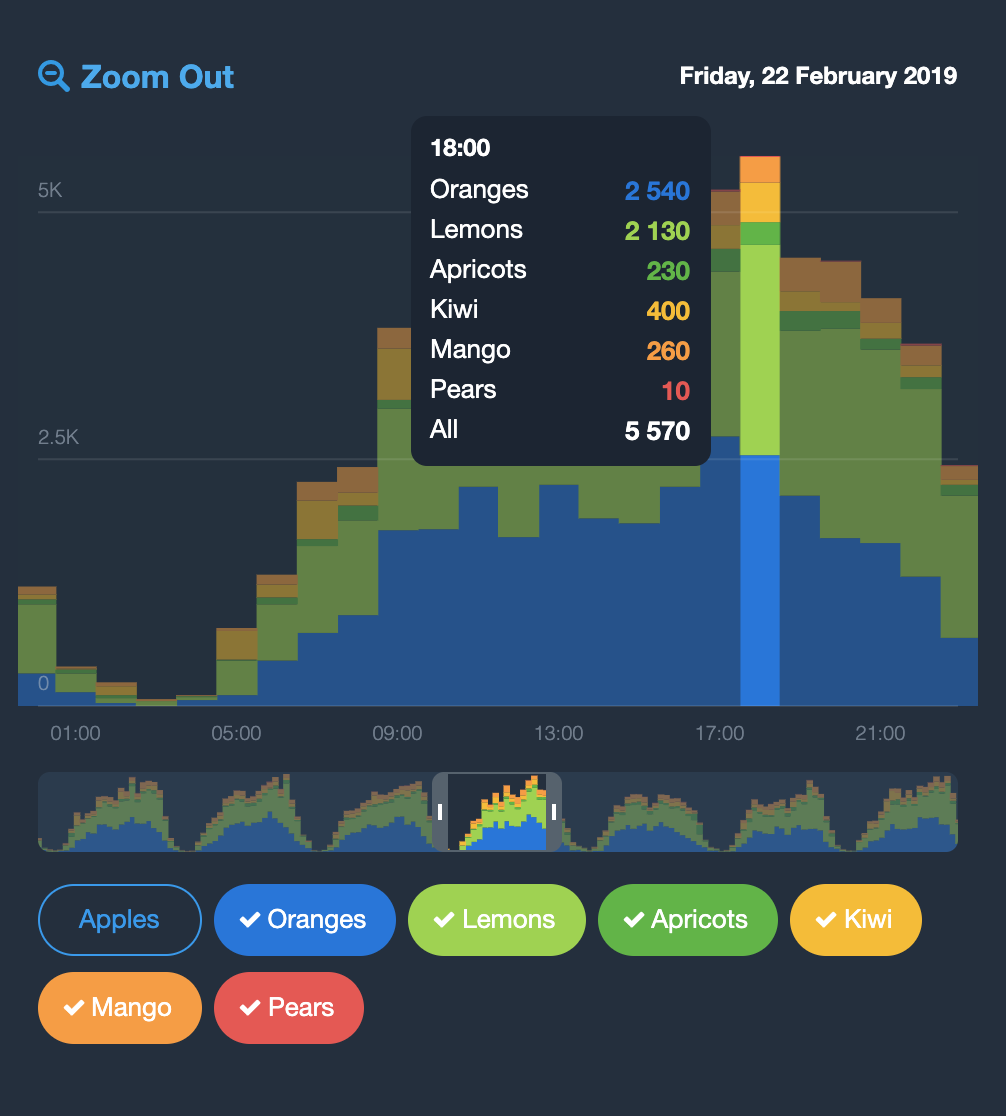
type |
Chart type. Supported types: line, area, bar, pie |
labels |
Array of UNIX timestamps in milliseconds |
datasets |
Array of params for each dataset |
datasets[*].name |
Dataset name |
datasets[*].color |
Dataset color |
datasets[*].values |
Array of dataset values |
isPercentage |
true for percentage based values |
isStacked |
true for values stacking on top of each other |
hasSecondYAxis |
true for charts with 2 Y axes |
onZoom |
Optional function which returns Promise with data for the zoomed chart (new data object) |