
A simple framework to enable easy logging of custom parameters (network activity, system status) along with other data (time, weather, news) from a Raspberry Pi to a display in a non-intrusive fashion.
Didn't make sense? Read on.
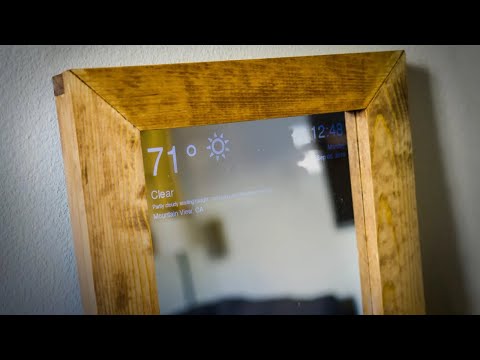
This project was inspired by the Magic Mirror project (Github, Youtube), which projects a display from behind a mirror. The screen is connected to your Pi to display news, weather and time. The idea is brilliant, and I wanted to extend it to display a few of my custom params
- White monospace text on black background looks good, especially at night
- Displays:
- Time in 24 hour format
- Randomly chosen quote from
/static/quotes.txt - Current temperature and city name
- Date, day, month, year
- Network activity in kBps (upload and download speeds in realtime)
- CPU and RAM usage percentage
- Updates in real time, ideal for use as a logger/monitor or simply a nerd photo frame
- Uses CSS3 Grids for easy addition/deletion/rearrangement of monitoring widgets
- Uses vanilla JS on the frontend, Flask backend. Lightweight, even for RPi.
My personal usecase was something along the lines of a digial clock that also displays some nerd stats like network activity and CPU/RAM usage.
I recently turned my Pi into a wireless router (See this https://frillip.com/using-your-raspberry-pi-3-as-a-wifi-access-point-with-hostapd/) and wanted a way to see various stats on the screen such as the total network throughput, clients connected and some basic stats here and there.
This status monitor is like a cherry on top of the in-progress pi-router project, and looks cool.
Other usecases I could think of
- Display latest rss feeds from your favourite blogs
- Subreddit top 5 posts for the day / trending posts on frontpage
- TCP connections established, something like
$ netstat -an | grep ESTABLISHED
Interesting additions possible
- Addition of speedometer like dials for things like network activity (see https://bernii.github.io/gauge.js/)
- Google calender / webdav integration for displaying upcoming appointments
- Template code for easy addition of rss feeds, output polled via
watchcommand for any custom bash command
- Raspberry Pi
- Wireless dongle (with AP capabilities) if Pi doesn't have onboard wireless
- Spare LCD display, IPS preferred
- Free time
- Follow this guide to setup wireless access point on your Raspberry Pi.
- I changed the name and password of Pi's hotspot to match my router and turned off router's wireless so that all devices switch automatically.
- Clone this repository
$ git clone https://github.com/abhn/RPi-Status-Monitor.git - cd into project directory
$ cd RPi-Status-Monitor - Create python 3 virtual environment
$ virtualenv env - Activate env
$ source env/bin/activate - Pip install requirements
$ pip install -r requirements.txt - Open
app.pywith any text editor and edit the following constantsLATandLONshould correspond to your location for weather updatesINTERFACE_NAMEshould be your network interface,wlan0in Pi's builtin wifi's case- Signup for openweathermap.org and get your API key. Add that key to your bashrc with
$ echo 'export OPENWEATHERAPI=<your-api-key> >> ~/.bashrcreplacing<your-api-keywith your actual API key
- Start development server with
$ python app.py - If you're on Pi, the built-in browser won't work (no support for CSS grid). Instead, download Chromium (
$ sudo apt-get install chromium-browser) and turn on experimental features - Open
http://localhost:5000in your browser and enter fullscreen mode (F11). Done. - ?? Profit!
- Automate the browser opening, server starting and going into full screen process for re-enabling things after reboot.
- Get connected clients list, sort data consumed during session and show real time bandwidth usage (
iw dev wlan0 station dump) - Maintain stats about data usage, most visited web/ip addresses in a mysql/postgres database and create a website ranking table
- Set block lists for ip addresses/website urls
- https://frillip.com/ for the guide on hostapd
- https://github.com/HackerShackOfficial for the inspiration
- GPLv3


