![]()
![]()

This web service serves as an introduction to the stock market for users new to finance. Users can learn about various financial terms, simulate trading stocks using a virtual balance, and view stock predictions based on probability and statistical data.
4 models are used: User, Stock, Portfolio, and Card. The database was designed to satisfy the three normal forms. The following diagrams summarize each model (using Chen Notation):

The User model extends Django's AbstractUser model for authenticating users. The default user model contains fields like username, email, and password (hashed). An additional field—balance—was added to save the user's balance when they log in.

The Stock model contains information about each stock. The ticker uniquely identifies each stock. The price and change fields are updated whenever the user views their portfolio.

The Portfolio model contains the number of shares the user owns of each stock. In addition, it contains two foreign keys referencing the user and stock model. Those models combined form the following diagram:

Portfolio exibits a many-to-one relationship with User and a one-to-many relationship with Stock. This way, one user can own multiple stocks, and multiple users can own the same stock. If the user removes their account, their portfolio goes with them. But if they sell all of a stock, the stock information remains in the Stock object for future trades.

The Card model contains the word and definition for every financial term used throughout the app. Besides displaying them as flashcards, some words are used in other views and their definition can be displayed through a popover.
The app is split up into 4 sections:
-
Screener: This is where users can filter stocks by country, price, sector, and exchange.
-
Flashcards: Users can view a list of financial terms used throughout the app.
-
Portfolio: Users can view a list of stocks they've invested in. They start off with $10,000 and can view how their net worth changes each day.
-
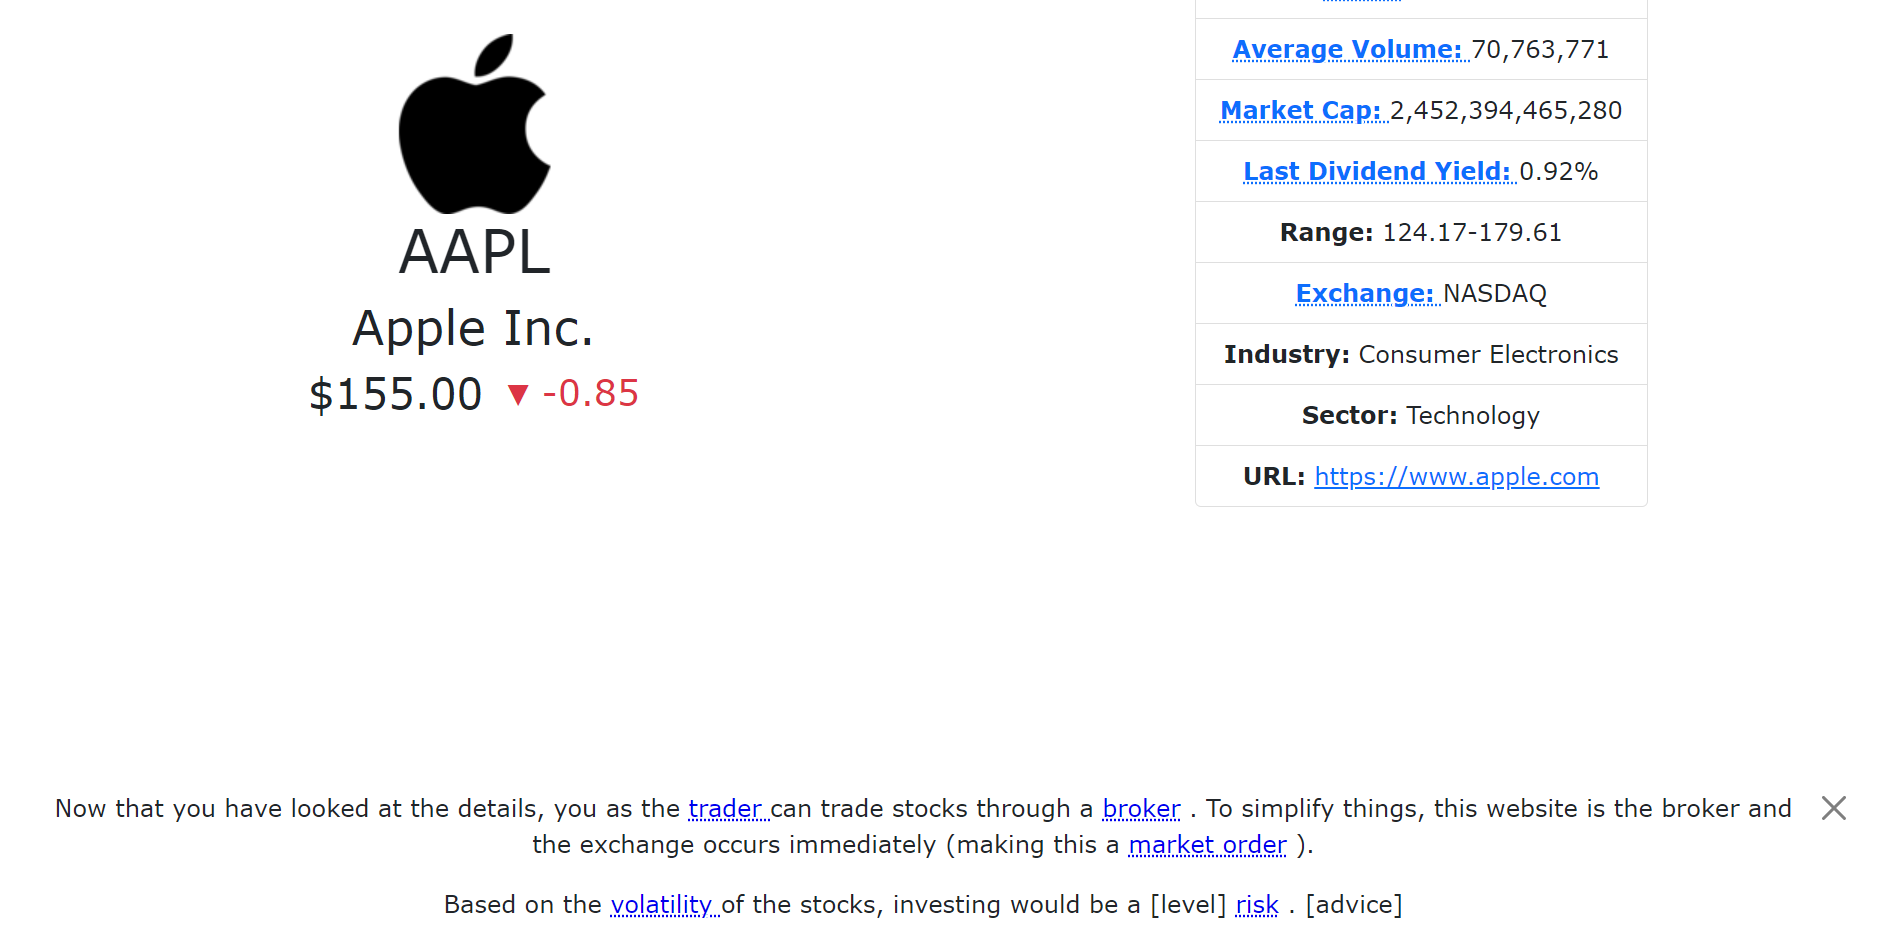
Details: This page shows stock information about a company as well as a detailed analysis of the stock price for short and long-term investments. This is also where users can trade stocks.
The app also features an authentication system so users can save their portfolio and balance whenever they're logged in. Logging in is required for the Portfolio and Details view. Using session cookies, the users' sessions can last up to 2 weeks.
The front-end is created in HTML, CSS, & JS and the back-end is created in Django and utilizes an SQLite database. Bootstrap was used to enhance the site's design and implement UI elements such as alerts and popovers. Chart.js was used to visualize the stock trends on the details page. And Financial Modeling Prep was the API used to implement the screener functionality and obtain detailed profiles and stock history from all the companies. Above everything else, this web app is designed to be responsive, accessible, and thoroughly tested.
This project is hosted live at Fly.io and can be accessed directly at https://how-to-stock-3.fly.dev. No installation required.
Before cloning this repo, you will need to obtain an API key from Financial Modeling Prep. Then do the following:
- Create a virtual environment, install all dependencies, save the API key, and run the Django server:
./start-local.sh YOUR_API_KEYorsource start-local.sh YOUR_API_KEY(See step 3 for the differences.) On future visits, the API key doesn't need to be provided. - Open
localhost:8000in your browser. - When done, press
CTRL/CMD-Cto stop the Django server. If you used./start-local.sh, you will return to your current shell. But if you usedsource start-local.sh, you will need to deactivate the virtual environment:deactivate
Make sure Docker and Docker Compose are installed. And make sure to obtain an API key from Financial Modeling Prep. Then do the following:
- Pass in the API key and start up a container for this app:
./start-docker.sh YOUR_API_KEY. On future visits, the container can be spun up directly using./start-docker.shordocker compose up -d. - Once everything's installed, open
localhost:8000in your browser. - When done, shut down and clean up the container:
docker compose down
When making a request to FMP for the first time in GitHub Actions, the requests may fail with the following response:
<html>
  <head>
    <title>403 Forbidden</title>
  </head>
  <body bgcolor="white">
    <center><h1>403 Forbidden</h1></center>
    <hr />
    <center>nginx/1.14.0 (Ubuntu)</center>
  </body>
</html>
This error goes away after re-running the jobs.
If the Postgres database is down, run the following commands to restart the machine:
fly machines list -a how-to-stock-3-db
fly machines start MACHINE_ID -a how-to-stock-3-db
If the remote builder fails:
WARN Failed to start remote builder heartbeat: server returned a non-200 status code: 500

Error: failed to fetch an image or build from source: error connecting to docker: server returned a non-200 status code: 500
Destroy the builder app and redeploy:
fly apps destroy APP_NAME
fly deploy
![dependabot[bot] avatar](https://avatars.githubusercontent.com/in/29110?v=4 "dependabot[bot]")