The code helps in plotting the energy band diagram of stacks of semiconductors and metals that are commonly used in Solar cell and LED research.
Example:
from Band_diagram import metal, semiconductor, plot
# # Define the metals and semiconductors
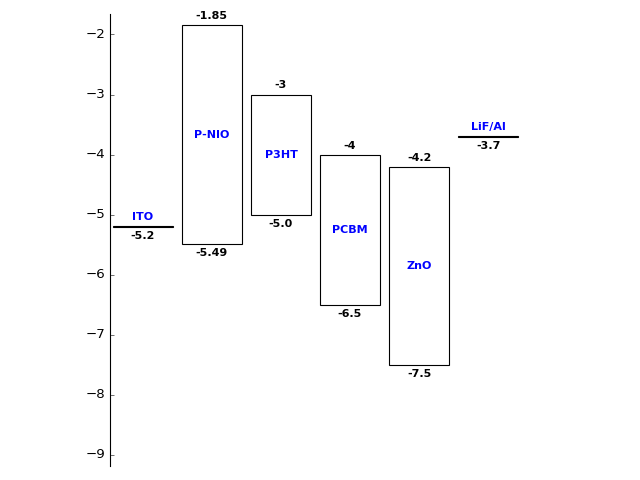
ITO = metal(wf = -5.2, name= 'ITO')
p_nio = semiconductor(cb = -1.85, vb = -5.49, name = 'P-NIO')
p3HT = semiconductor(cb = -3, vb = -5.0, name = 'P3HT')
PCBM = semiconductor(cb = -4, vb = -6.5, name = 'PCBM')
ZnO = semiconductor(cb = -4.2, vb = -7.5, name = 'ZnO')
LiF_Al = metal(wf=-3.7, name = 'LiF/Al')
## Create the stack
stack = [ITO,p_nio,p3HT,PCBM,ZnO,LiF_Al]
## plot the stack
plot(stack, filepath = 'Images/Stack1.png')
will result in