Comments (12)
 DavidMachineLearning
commented on May 24, 2024
1
DavidMachineLearning
commented on May 24, 2024
1
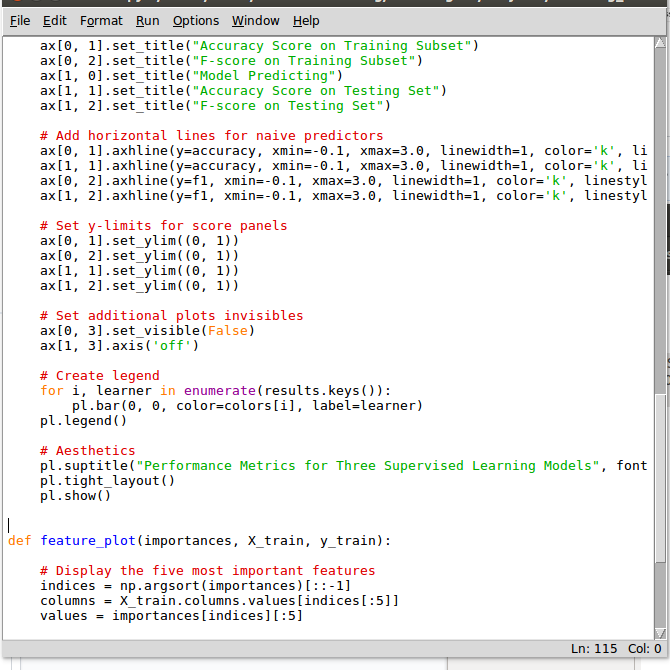
Ok i found a trick to fix the issue.
In visual.py write:
fig, ax = pl.subplots(2, 4, figsize=(11, 7)) # replace the code on line 63 with this
then delete the block "# Create patches for the legend"
and replace it with the following
# Set additional plots invisibles
ax[0, 3].set_visible(False)
ax[1, 3].axis('off')

# Create legend
for i, learner in enumerate(results.keys()):
    pl.bar(0, 0, color=colors[i], label=learner)
pl.legend()
from machine-learning.
 fabio-reale
commented on May 24, 2024
1
fabio-reale
commented on May 24, 2024
1
Thanks @DavidMachineLearning, you just fixed my problem 28 days ago.
from machine-learning.
DavidMachineLearning
commented on May 24, 2024
You can fix that issue by changing the "figsize" parameter on the line 63 in visuals.py script.
i used figsize=(25,15)
from machine-learning.
 josiasMO
commented on May 24, 2024
josiasMO
commented on May 24, 2024
I'm having the same issue, even after trying the solution above.
This happens for both Python 2 and 3 environments.

from machine-learning.
DavidMachineLearning
commented on May 24, 2024
If you want to make the image bigger, you can change the "figsize" parameter.
If you have any questions, just ask :)
from machine-learning.
josiasMO
commented on May 24, 2024
I still have this issue, even with the new version of the visuals.py.
Do you have idea of what could be wrong, @DavidMachineLearning ?
Thanks

from machine-learning.
DavidMachineLearning
commented on May 24, 2024
I don't see any issue, the visualization now is good.
Are you talking about the scores? @josiasMO
from machine-learning.
josiasMO
commented on May 24, 2024
@DavidMachineLearning, for me looks like the plots are stretch and my results are not ok, since my scores are always 1 for all the classifiers. Do you think that there's a problem with it?
Results:
{ 'RandomForestClassifier':{
0:{
'pred_time':0.007110118865966797,
'f_test':1.0,
'train_time':0.03833603858947754,
'acc_train':1.0,
'acc_test':1.0,
'f_train':1.0
},
1:{
'pred_time':0.007297992706298828,
'f_test':1.0,
'train_time':0.03605389595031738,
'acc_train':1.0,
'acc_test':1.0,
'f_train':1.0
},
2:{
'pred_time':0.007183074951171875,
'f_test':1.0,
'train_time':0.10063600540161133,
'acc_train':1.0,
'acc_test':1.0,
'f_train':1.0
}
},
'GaussianNB':{
0:{
'pred_time':0.01777195930480957,
'f_test':1.0,
'train_time':0.008568048477172852,
'acc_train':1.0,
'acc_test':1.0,
'f_train':1.0
},
1:{
'pred_time':0.012537956237792969,
'f_test':1.0,
'train_time':0.010205984115600586,
'acc_train':1.0,
'acc_test':1.0,
'f_train':1.0
},
2:{
'pred_time':0.011970043182373047,
'f_test':1.0,
'train_time':0.10333013534545898,
'acc_train':1.0,
'acc_test':1.0,
'f_train':1.0
}
},
'DecisionTreeClassifier':{
0:{
'pred_time':0.005405902862548828,
'f_test':1.0,
'train_time':0.0017800331115722656,
'acc_train':1.0,
'acc_test':1.0,
'f_train':1.0
},
1:{
'pred_time':0.0047490596771240234,
'f_test':1.0,
'train_time':0.0030469894409179688,
'acc_train':1.0,
'acc_test':1.0,
'f_train':1.0
},
2:{
'pred_time':0.008773088455200195,
'f_test':1.0,
'train_time':0.03356003761291504,
'acc_train':1.0,
'acc_test':1.0,
'f_train':1.0
}
}
}
from machine-learning.
fabio-reale
commented on May 24, 2024
There is definetly a problem with your scores, @josiasMO. Itˋs hard to know exactly where without looking at the code.
But, since the scores are always 1.0 this means the accuracy and f methods are probably receiving the same variable twice. So, I recomend you make sure you are passing two distinct variables, one from the data set and one from the prediction process.
Given that your problem is no longer with the plots, if the difficulty persists I recommend you try the Udacity forum or the slack. That will probably lower the time it takes for someone to assist you.
from machine-learning.
josiasMO
commented on May 24, 2024
Thanks @fabio-reale and @DavidMachineLearning.
I found the problem. I wasn't doing the one-hot encode properly. I'm truly sorry for thinking that the problem was with my plot.
Again, thanks a lot for the help.
from machine-learning.
 pedronovaes
commented on May 24, 2024
pedronovaes
commented on May 24, 2024
Another solution to this problem is replacing the pl.legend to fig.legend and adjusting the bbox_to_anchor to (0.5, 1.05):
fig.legend(handles = patches, bbox_to_anchor = (0.5, 1.05), \
           loc = 'upper center', borderaxespad = 0, ncol = 3, fontsize = 'x-large')
from machine-learning.
 jo4x962k7JL
commented on May 24, 2024
jo4x962k7JL
commented on May 24, 2024
For people who want the same plot as before, you could try this:
- Adjust figsize from (11, 7) to (16, 12)
- Adjust bbox_to_anchor position from (-.80, 2.53) to (-.80, 2.40)
- Adjust pl.suptitle position from y=1.10 to y=0.99
- Delete pl.tight_layout(), this is the most important
    # Create figure
    #fig, ax = pl.subplots(2, 3, figsize = (11,7))
    fig, ax = pl.subplots(2, 3, figsize = (16, 12))

    #pl.legend(handles = patches, bbox_to_anchor = (-.80, 2.53), \
    pl.legend(handles = patches, bbox_to_anchor = (-.80, 2.40), \

    # Aesthetics
    #pl.suptitle("Performance Metrics for Three Supervised Learning Models", fontsize = 16, y = 1.10)
    pl.suptitle("Performance Metrics for Three Supervised Learning Models", fontsize = 16, y = 0.99)
    #pl.tight_layout()
from machine-learning.
Related Issues (20)
- projects/smartcab/images should be inside projects/smartcab/smartcab
- titanic case - change print to print() to work on python 3
- Foundation course - bike share analysis python notebook won't autosave HOT 1
- typo in practices of naive bayes tutorial HOT 1
- Unable to load finding_donors.ipynb file using either Jupyter or ipython HOT 2
- simulator.py looks for images in the main smartcab folder
- Python 2.7 for Boston project?
- DeprecationWarning HOT 1
- New logo / icon
- scipy is also required HOT 2
- The URL to Jupyter notebook in docs is misleading HOT 1
- ShuffleSplit HOT 5
- Images Folder is placed in wrong path HOT 1
- /logs/ folder missing in smartcab project HOT 1
- wrong sklearn import library in finding_donors ipynb fie HOT 3
- there are so many problem when running the file in the terminal HOT 3
- MACHINE LEARNING
- Machine learning
- PROJECTS FOR MACHINE LEARNING
Recommend Projects
-
 React
React
A declarative, efficient, and flexible JavaScript library for building user interfaces.
-
Vue.js
🖖 Vue.js is a progressive, incrementally-adoptable JavaScript framework for building UI on the web.
-
 Typescript
TypeScript is a superset of JavaScript that compiles to clean JavaScript output.
-
TensorFlow
An Open Source Machine Learning Framework for Everyone
-
Django
The Web framework for perfectionists with deadlines.
-
 Laravel
A PHP framework for web artisans
-
D3
Bring data to life with SVG, Canvas and HTML. 📊📈🎉
-
Recommend Topics
-
javascript
JavaScript (JS) is a lightweight interpreted programming language with first-class functions.
-
web
Some thing interesting about web. New door for the world.
-
server
A server is a program made to process requests and deliver data to clients.
-
Machine learning
Machine learning is a way of modeling and interpreting data that allows a piece of software to respond intelligently.
-
Visualization
Some thing interesting about visualization, use data art
-
Game
Some thing interesting about game, make everyone happy.
Recommend Org
-
Facebook
We are working to build community through open source technology. NB: members must have two-factor auth.
-
Microsoft
Open source projects and samples from Microsoft.
-
Google
Google ❤️ Open Source for everyone.
-
Alibaba
Alibaba Open Source for everyone
-
D3
Data-Driven Documents codes.
-
Tencent
China tencent open source team.
from machine-learning.