Comments (82)
 dupski
commented on May 22, 2024
53
dupski
commented on May 22, 2024
53
Hey all, I've just done a load of work on this. I have a test project working will full debugging of both .ts code and mocha tests. Here's my config (requires Node 6.3 or above and I am using VS Code 1.11):
tsconfig.json: (just need to make sure sourceMap is true)
{
    "compilerOptions": {
        "module": "commonjs",
        "target": "es5",
        "noImplicitAny": true,
        "outDir": "./dist",
        "sourceMap": true
    },
    "include": [
        "src/**/*"
    ],
}
launch.json:
{
    "version": "0.2.0",
    "configurations": [
        {
            "name": "Current TS File",
            "type": "node",
            "request": "launch",
            "program": "${workspaceRoot}/node_modules/ts-node/dist/_bin.js",
            "args": ["${relativeFile}"],
            "cwd": "${workspaceRoot}",
            "protocol": "inspector"
        },
        {
            "name": "Current TS Tests File",
            "type": "node",
            "request": "launch",
            "program": "${workspaceRoot}/node_modules/.bin/_mocha",
            "args": ["-r", "ts-node/register", "${relativeFile}"],
            "cwd": "${workspaceRoot}",
            "protocol": "inspector"
        }
    ]
}
The key is to make sure you don't run a script that does a process.spawn() as I believe this interferes with node's ability to debug properly, hence running ts-node/dist/_bin.js above.
If the above works for others, maybe the _bin.js script could be exposed in a slightly nicer way @blakeembrey ?
Sample github project:
https://github.com/EnterpriseJSTutorial/vscode-ts-node-debugging
from ts-node.
 arturoarevalo
commented on May 22, 2024
33
arturoarevalo
commented on May 22, 2024
33
I've been able to debug TypeScript code running directly with ts-node (this is without precompilation), even inside a Docker container, within VS Code, using the "V8 Inspector Integration" feature in Node > 6.3.
My tsconfig.json:
{
    ...
    "compilerOptions": {
         ...
        // "sourceMap": true,
        "inlineSources": true    // use inlineSources instead of sourceMap
    },
    ...
}
My launch configuration in VSCode's launch.json:
        {
            "type": "node2",
            "request": "attach",
            "name": "Attach to Port",
            "port": 9229
        }
Just run your script with --inspect=PORT (9229 by default), i.e. ts-node --inspect source/index.ts
To force a break on the first line of application code add --debug-brk, i.e. ts-node --inspect --debug-brk index.ts
This solution isn't restricted to VS Code ... any debugger that supports the V8 Inspector protocol can be used. The most trivial one is Chrome DevTools ...
from ts-node.
 blakeembrey
commented on May 22, 2024
31
blakeembrey
commented on May 22, 2024
31
Just verified it working locally by creating a new project. All I did is below. Can someone confirm this?
        {
            "type": "node",
            "request": "launch",
            "name": "Launch Program",
            "runtimeArgs": [
                "-r",
                "ts-node/register"
            ],
            "args": [
                "${workspaceFolder}/index.ts"
            ]
        }
from ts-node.
 cspotcode
commented on May 22, 2024
15
cspotcode
commented on May 22, 2024
15
Debugging in VSCode is now very simple and works well.
{ // launch.json
    "version": "0.2.0",
    "configurations": [
        {
            "name": "Launch Program",
            "type": "node",
            "request": "launch",
            "protocol": "inspector",
            // Use ts-node as drop-in replacement for node
            "runtimeExecutable": "${workspaceRoot}/node_modules/.bin/ts-node",
            // Manually specify the args to pass
            "runtimeArgs": [
                "${workspaceRoot}/src/foo.ts"
            ]
        }
    ]
}
If you try to specify "program" config, VSCode will see that it's a .ts file and try to locate the corresponding compiled .js file. We don't want that; we're using ts-node so we want to run the .ts directly. "runtimeArgs" does what we want, and VSCode doesn't interfere or complain.
Anway, breakpoints "just work!" Sweet!
from ts-node.
 amcdnl
commented on May 22, 2024
14
amcdnl
commented on May 22, 2024
14
😒
from ts-node.
 rjmacarthy
commented on May 22, 2024
11
rjmacarthy
commented on May 22, 2024
11
I'd be very interested to know if anyone finds a good solution to this problem too.
from ts-node.
 xs9627
commented on May 22, 2024
8
xs9627
commented on May 22, 2024
8
Thanks, @giggio. "protocol": "inspector" works for me.
Here is the launch.json to debug mocha with ts-node:
{
      "name": "Run mocha",
      "type": "node",
      "request": "launch",
      "program": "${workspaceRoot}/node_modules/mocha/bin/_mocha",
      "stopOnEntry": false,
      "args": ["--no-timeouts", "--compilers", "ts:ts-node/register", "${workspaceRoot}/test/**/*.test.ts"],
      "cwd": "${workspaceRoot}",
      "protocol": "inspector"
}
VSCode (1.10.2).
from ts-node.
 k8w
commented on May 22, 2024
6
k8w
commented on May 22, 2024
6
It seems this only works when ts-node is installed in the workspaceRoot, but not work when refer to a global ts-node.
While mocha with ts-node works both global and local.
{
    "version": "0.2.0",
    "configurations": [
        {
            "name": "Current TS File",
            "type": "node",
            "request": "launch",
            "program": "${workspaceRoot}/node_modules/ts-node/dist/_bin.js",
            "args": ["${relativeFile}"],
            "cwd": "${workspaceRoot}",
            "protocol": "inspector"
        },
        {
            "name": "Current TS Tests File",
            "type": "node",
            "request": "launch",
            "program": "${workspaceRoot}/node_modules/.bin/_mocha",
            "args": ["-r", "ts-node/register", "${relativeFile}"],
            "cwd": "${workspaceRoot}",
            "protocol": "inspector"
        }
    ]
}
from ts-node.
 cgatian
commented on May 22, 2024
6
cgatian
commented on May 22, 2024
6
@cspotcode I was unable to get the breakpoints to hit unless I supplied a debugger statement.
from ts-node.
 tomitrescak
commented on May 22, 2024
6
tomitrescak
commented on May 22, 2024
6
I just paste here couple solutions that work nicely:
Launch
{
      "name": "TS Node",
      "type": "node",
      "request": "launch",
      "env": {
        ... whatever
      },
      "args": ["./src/server/index.ts"],
      "runtimeArgs": ["--nolazy", "-r", "ts-node/register"],
      "sourceMaps": true,
      "cwd": "${workspaceRoot}",
      "protocol": "inspector"
    }
Attach With Forever
this is particularly cool, as the forever automatically restarts the process and debugger automatically re-attaches 👍
{
      "name": "Forever",
      "type": "node",
      "request": "attach",
      "sourceMaps": true,
      "restart": true,
      "port": 9229,
      "cwd": "${workspaceRoot}",
      "protocol": "inspector"
    }
And the command
forever -a --watch --watchDirectory ./src/server --uid youruid -c \"node --nolazy -r ts-node/register --inspect=9229\" src/server/index.ts
from ts-node.
 GuillaumeDesforges
commented on May 22, 2024
6
GuillaumeDesforges
commented on May 22, 2024
6
If anybody lands here, I'd advise using ts-node-dev
example: https://gist.github.com/GuillaumeDesforges/bf7383f8403e1683b2b9467db3964185
from ts-node.
 giggio
commented on May 22, 2024
5
giggio
commented on May 22, 2024
5
This works with launch as well. I just got it to run with the latest VSCode (1.10.2).
This is the config in launch.json:
        {
            "type": "node",
            "request": "launch",
            "name": "Launch Program",
            "program": "${workspaceRoot}\\server\\bin\\www.js",
            "protocol": "inspector"
        }
And I did not have to set inlineSources to true or any of the source maps configs on ts.config.
from ts-node.
blakeembrey
commented on May 22, 2024
2
You're going to have to provide more information for me to replicate. I personally don't even use VSCode, so have no idea what this issue even means or where to start. How do I reproduce it? It's unlikely it's an issue with ts-node, but I don't know where to start.
from ts-node.
 arolson101
commented on May 22, 2024
2
arolson101
commented on May 22, 2024
2
Looks like things have changed- https://code.visualstudio.com/docs/editor/debugging:
VS Code supports both the inlined source maps and the inlined source.
I've tried turning on these options but breakpoints still don't work for me. My config:
{
    "version": "0.2.0",
    "configurations": [
        {
            "name": "Test",
            "type": "node",
            "request": "launch",
            "program": "${workspaceRoot}/node_modules/mocha/bin/_mocha",
            "stopOnEntry": false,
            "args": ["--require", "ts-node/register", "test/table.test.ts"],
            "cwd": "${workspaceRoot}",
            "preLaunchTask": null,
            "runtimeExecutable": null,
            "runtimeArgs": [
                "--nolazy"
            ],
            "env": {
                "NODE_ENV": "development"
            },
            "externalConsole": false,
            "sourceMaps": true,
            "outDir": null
        },
from ts-node.
 evgenyt1
commented on May 22, 2024
2
evgenyt1
commented on May 22, 2024
2
@cspotcode I had to replace "runtimeArgs" with "args" to make it work and add debugger statement as @cgatian
Otherwise --inspect=12400 --debug-brk args are passed after foo.ts and are ignored by ts-node
node: 8.9.4
ts-node: 4.1.0
vs-code: 1.9.3
from ts-node.
 zwhitchcox
commented on May 22, 2024
2
zwhitchcox
commented on May 22, 2024
2
{
      "name": "TS Node",
      "type": "node",
      "request": "launch",
      "env": {
        ... whatever
      },
      "args": ["./src/server/index.ts"],
      "runtimeArgs": ["--nolazy", "-r", "ts-node/register"],
      "sourceMaps": true,
      "cwd": "${workspaceRoot}",
      "protocol": "inspector"
    }
This did not work for me...the only think that has worked is manually compiling the typescript files and then manually running the debugger
from ts-node.
 mccool
commented on May 22, 2024
1
mccool
commented on May 22, 2024
1
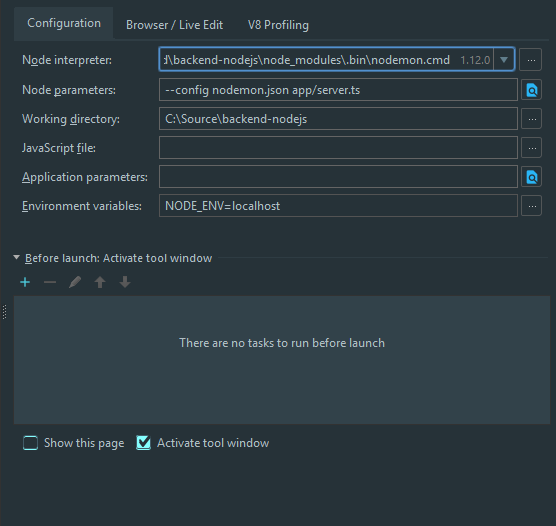
@sinedied I have gotten it to work with webstorm 2017.2 EAP using nodemon. I have nodemon and ts-node installed in devDependencies. In my tsconfig.json I have "sourceMap":true and in my nodemon.json file i have included
{
  "exec": "./node_modules/.bin/ts-node --debug-brk src/server",
  "ext": "ts"
}
With webstorm you have to use --debug-brk so that its debugger can attach to it as mentioned in this comment.
My configuration settings is shown below as well

The issue I'm seeing with this is that the breakpoints aren't really set until the server restarts. If you remove a breakpoint it won't really be gone until the server restarts again. I think this is just how it works with nodemon though.
Another option is to set ts-node as the node interpreter, pass --debug=some_port, and the start script. Run this then set up a remote node.js debugger with the port you specified in the node.js configuration and run it in debug mode.


Hopefully these options get you up and debugging.
from ts-node.
 IAMtheIAM
commented on May 22, 2024
1
IAMtheIAM
commented on May 22, 2024
1
@mccool I could not get any of the 3 examples you explained working for IntelliJ / WebStorm. When I do your 3rd option "debug": "./node_modules/.bin/ts-node --debug-brk --project tsconfig.json ./app/server.ts",
then start the debugger, it says Debugger listening on [::]:5858 but then my main app is not running on port 5000, so when I load the page, nothing happens. If I start the app server separately then run this debug command, no breakpoints are hit.
Any ideas?
UPDATE: I got it working with nodemon as the node interpreter
//nodemon.json

{
    "execMap": {
        "js": "node",
        "ts": "./node_modules/.bin/ts-node"
    },
    "watch": [
        "app",
        "config"
    ],
    "ext": "js,ts"
}
Then run the Node.JS run configuration in Debug mode, and breakpoints are hit! thanks @mccool
from ts-node.
 peternann
commented on May 22, 2024
1
peternann
commented on May 22, 2024
1
I'm still getting patchy breakpoint behaviour. It seems to work reliably in the primary file (index.ts), but not in other imported files.
Interestingly, it works somewhat more reliably after a restart of VSCode.
I'm testing a very short-lived script - It feels a bit like a race condition during startup perhaps.
Strangely, WHETHER OR NOT the breakpoint happens to work in any one run, hovering over the breakpoints list in VSCode, after running, always says "Breakpoint ignored because generate code not found (source map problem?)". Yes, it even says that on the rare occasion that IT WORKS.
Breakpoint debugging is simply not working reliably for me I'm afraid.
Bummer.
Is any special content required in tsconfig.json? And/Or is it necessary for it to be non-existant?
from ts-node.
 foxundermoon
commented on May 22, 2024
1
foxundermoon
commented on May 22, 2024
1
Unverified breakpoint
when start by nodemon --config nodemon.json --exec \"node --inspect=56386 --nolazy -r dotenv/config -r ts-node/register src/app.ts\"
without nodemon ,the breakpoint is ok
from ts-node.
amcdnl
commented on May 22, 2024
@blakeembrey absolute; so its rather simple. do require('ts-node/register') and set a breakpoint in any file from there. I'm positive its related to source maps not getting mapped correctly when using register. If you need more details, let me know if you can't reproduce and i'll create a demo repo.
What IDE you use? VSCode seems like a obvious TS user IDE.
from ts-node.
 enlight
commented on May 22, 2024
enlight
commented on May 22, 2024
I've hit this issue today, though I'm not using the latest revision and it seems like there have been some changes to source map generation lately. The main problem here I think is that VSCode seems to require access to a .js file on disk, but ts-node doesn't emit the generated code to a file. The TypeScript inlineSources compiler options could've perhaps provided a workaround, unfortunately according to the docs https://code.visualstudio.com/docs/editor/debugging
VS Code supports inlined source maps but not inlined source
so that's a dead end unless someone adds support for it in VSCode.
from ts-node.
blakeembrey
commented on May 22, 2024
Yeah, it sounds like this is unlikely to ever work then. That's unfortunate. VSCode would have to hook into source-map-support to make this happen, which someone might be able to do easily enough. Since all the generated files and source maps are in memory, if there's some way to communicate that then we can make it work, otherwise you'll have to rely on actually transpiling files for now.
from ts-node.
 jonaskello
commented on May 22, 2024
jonaskello
commented on May 22, 2024
I am using ts-node to run mocha. I can get debugging to work in Webstorm although there are issues:
- Webstorms own breakpoints does not work, I need to explicitly add a "debugger" statement in the source code.
- Webstorm highlights the wrong line. It is about 20 lines off from the debugger statement. But the locals, watches and stack displays correct information.
Is there some way to verify that the source maps generated in memory are correct when running mocha?
from ts-node.
jonaskello
commented on May 22, 2024
Tried setting both inlineSourceMap and inlineSources to true in tsconfig.json but exact same behaviour in Webstorm.
from ts-node.
blakeembrey
commented on May 22, 2024
The source maps are all correct, I believe the issue is what I mentioned above - the fact they don't have access to the source maps. If there's some way to make access possible, I'll investigate it. Perhaps the source map location could be absolute and I could write the files into a temporary directory during execution.
from ts-node.
blakeembrey
commented on May 22, 2024
@arolson101 I believe you misunderstand. There's no difference. TypeScript still does not have access to the source maps of ts-node - they are in memory. I have a working debugger just fine with VS Code, but you need to emit the .js and source map files for VS Code to consume (and configure outDir) and not use ts-node.
from ts-node.
blakeembrey
commented on May 22, 2024
Coming back to this, I use VS Code now and often use the debugging feature. However, I recommend you compile the JavaScript files with source maps and execute those directly instead. It's pretty simple with VS Code to set up a CLI task that watches and compiles using tsc and restarts the program while listening to the debugger.
from ts-node.
 nbransby
commented on May 22, 2024
nbransby
commented on May 22, 2024
Does this mean no translated stack traces from node when an uncaught exception is thrown whilst debugging in vscode?
from ts-node.
blakeembrey
commented on May 22, 2024
No. How are you debugging in vscode?
from ts-node.
nbransby
commented on May 22, 2024
Without using ts-node, obviously works fine but I switched to ts-node so I could have proper stack traces on a crash but then the debugger doesn't pick up the breakpoints. So I have both configs in my launch.json and I just comment in/out the relevant one depending if I want to debug or run
from ts-node.
blakeembrey
commented on May 22, 2024
Did you read this issue?
from ts-node.
blakeembrey
commented on May 22, 2024
If you want to re-map errors according to source maps, I'd recommend checking out https://github.com/evanw/node-source-map-support.
from ts-node.
nbransby
commented on May 22, 2024
I did read it, I assumed by " I recommend you compile the JavaScript files with source maps and execute those directly instead" you meant don't use ts-node.
I did look at that project before but looked like far more effort to setup compared to ts-node, i'll stick with switching configs for now
from ts-node.
blakeembrey
commented on May 22, 2024
Yes, that's exactly what I recommend. I'm not sure what you're asking now, sorry. That project is only one line - you asked for source map support with stack traces?
from ts-node.
nbransby
commented on May 22, 2024
yes will take another look thanks
from ts-node.
amcdnl
commented on May 22, 2024
'm coming back to this after a bit, have a few comments since first started...
TypeScript still does not have access to the source maps of ts-node - they are in memory\
@blakeembrey Are you not saving the files to disk at all? I know babel/register actually does that.
The main problem here I think is that VSCode seems to require access to a .js file on disk, but ts-node doesn't emit the generated code to a file. The TypeScript inlineSources compiler options could've perhaps provided a workaround, unfortunately according to the docs...
@enlight you should check this out, looks like it has it now microsoft/vscode#2803
I'd recommend checking out https://github.com/evanw/node-source-map-support.
@blakeembrey would be worth considering building this into ts-node.
I have a working debugger just fine with VS Code, but you need to emit the .js and source map files for VS Code to consume (and configure outDir) and not use ts-node.
@blakeembrey so I have to ask if this is necessary what is the point of this project? ;)
from ts-node.
blakeembrey
commented on May 22, 2024
Are you not saving the files to disk at all?
No, that's the entire point. Babel does it as a cache, but a cache doesn't help much with TypeScript since it's not a single file cache and requires the entire project loaded anyway for compilation errors. In --fast mode, it's possible we could do it. On top of this, if VS Code (or other debuggers) can use the source maps from files while executing the rest in memory, I'm happy to make that change - it seems like a great fix to me.
would be worth considering building this into ts-node.
It has been since the first release.
so I have to ask if this is necessary what is the point of this project?
Lots of people have different use-cases to you and may not use an IDE debugger. For instance, I've never really used it (for something I'd use ts-node for). I tend to use ts-node for running tests without needing to compile them and restructure the entire project with fixtures.
from ts-node.
amcdnl
commented on May 22, 2024
Thanks for clarifying those details! I'm just trying to understand the use cases for the project given the hurdles.
I hate having to have tool and workflow for build/etc when this theoretically could be done on the fly 😞
from ts-node.
blakeembrey
commented on May 22, 2024
Understandable - I think it'd be valuable to check if generating the source map contents into a temp file would fix this. I'll make that change when I get a chance, probably just rewriting contents into tmp/<sha> files for caching and lookup later. I really feel it might fix this, so thanks for the idea!
from ts-node.
amcdnl
commented on May 22, 2024
@blakeembrey awesome!! Let me know and i'll give it a try on my demo project I'm working on.
For reference, on the Babel page you can see BABEL_CACHE_PATH variable which sets the path BABEL_CACHE_PATH=/foo/my-cache.json babel-node script.js. By default I think it saves them in node_modules that being local or global.
from ts-node.
 jeffijoe
commented on May 22, 2024
jeffijoe
commented on May 22, 2024
Any progress on this? I'm using the CLI with nodemon and ts-node + attach in VSCode
from ts-node.
blakeembrey
commented on May 22, 2024
I went ahead and built #148. Feel free to test it and let me know if it works.
I have a suspicion that it won't though. VS Code needs to be able to discover the source map file. If it could do that, it should have been doing that already with previous versions. The issue is that VS Code needs access to both .js and .js.map files to work properly with debugging.
from ts-node.
amcdnl
commented on May 22, 2024
@blakeembrey couldn't you inline the sourcemaps?
from ts-node.
blakeembrey
commented on May 22, 2024
@amcdnl That's how it worked in 0.x.
from ts-node.
amcdnl
commented on May 22, 2024
I'll test it out shortly and let you know! Thanks for looking into it either way!
from ts-node.
 trainerbill
commented on May 22, 2024
trainerbill
commented on May 22, 2024
Yeah this is tricky. I wanted a way to debug my test scripts. I started by trying to create a task.json which would run my npm test script and setting the breakpoints and they would get skipped due to sourcemaps or some error. After hours of playing around I just add a Debug launch.json task with the program as the currently open file.
launch.json
{
    "version": "0.2.0",
    "configurations": [
        {
            "name": "Debug",
            "type": "node",
            "request": "launch",
            "cwd": "${workspaceRoot}",
            "program": "${file}",
            "stopOnEntry": false,
            "sourceMaps": true,
            "outDir": "${workspaceRoot}/dist"

        }
    ]
}
tsconfig.json
{
    "compileOnSave": true,
    "compilerOptions": {
        "module": "commonjs",
        "target": "es2015",
        "sourceMap": true,
        "inlineSources": true,
        "isolatedModules": true,
        "outDir": "./dist"
    },
    "exclude": [
        "node_modules"
    ]
}
Now when I go to debugger set a breakpoint, and launch the Debug on the open file, it breaks as expected. This is good enough for me since if I am setting breakpoints I really only want to run the one file anyway and not the entire test suite.
Most of my development is test driven so the classes are only constructed in the tests. I can set breakpoints in the src/module.ts file as well and when the test executes them it breaks there as well.
The only drawback is that now my ./dist folder contains src and test folders, but I am going to either npm/git ignore them or write some logic into my versioning script to remove dist/test and move the files from dist/src to /dist.
So this really isn't even a ts-node issue as everything is doable in VSCode.
Quick Update:
compileOnSave currently doesn't work until VSCode 2.0. I added watch:true to tsconfig and made a build task:
task.json
{
  "name": "npmTask",
  "suppressTaskName": true,
  "command": "npm",
  "isShellCommand": true,
  "args": [
    "run"
  ],
  "tasks": [
    {
      "taskName": "test",
      "isBuildCommand": false,
      "isTestCommand": true,
      "args": [
        "test"
      ]
    },
    {
      "taskName": "build",
      "isBuildCommand": true,
      "isTestCommand": false,
      "args": [
        "build"
      ]
    }
  ]
}
Now when I start VSCode i SHFT+CTRL+B which runs my npm build task:
rm -rf ./dist && tsc
and watches for changes.
When I save a file it recompiles and I can run my debugger again.
from ts-node.
 vigie
commented on May 22, 2024
vigie
commented on May 22, 2024
@arturoarevalo could you expand a little - when you set inlineSources tsc forces you to also set either sourceMap or inlineSourceMap - which do you set? Also, by setting these aren't you implying that you are in fact transpiling before launching the debugger, or does ts-node somehow use these settings under the hood?
from ts-node.
vigie
commented on May 22, 2024
Just to confirm, I also now have the set-up @arturoarevalo describes above working, except that setting inlineSources or any other mapping flag in tsconfig.json is not needed. I also do not have sourceMaps set within my launch.json.
With the above set-up you are not explicitly generating or linking to transpiled code or maps. What happens is that ts-node generates and writes the files to a temporary location on disk as the typescript files are loaded by node, and the debugger is smart enough to locate and use those maps. You can see this happening if you launch the debugger with the verboseDiagnosticLogging flag set. It's a pretty nice set-up.
The thing that threw me to begin with was that I was trying to get breakpoints to stick in typescript files before the had been required by the running program. This is not possible - the typescript file must be loaded first and then you can hit whatever breakpoints you like from within functions in that file.
from ts-node.
rjmacarthy
commented on May 22, 2024
Pretty good solution @arturoarevalo thank you.
from ts-node.
 moemamoe
commented on May 22, 2024
moemamoe
commented on May 22, 2024
@arturoarevalo thanks a lot! I have been looking for a solution like that for a long time..
Just one thing here: It works perfectly if I attach to my local ts-node application, but if it is running inside a Docker container, the breakpoints are shifted if the file is more complex (I still can attach and debug but the source maps seem not to work right, even empty lines shift the code). Setting the tsconfig.json to inlineSources doesn't change anything.
Have you experienced something like that?
from ts-node.
amcdnl
commented on May 22, 2024
I still can't seem to get it to work, mind sharing your tsconfig and vscode launch config?
from ts-node.
moemamoe
commented on May 22, 2024
My tsconfig:
{
  "compilerOptions": {
    "declaration": false,
    "emitDecoratorMetadata": true,
    "experimentalDecorators": true,
    "lib": [
      "es6",
      "dom"
    ],
    "module": "commonjs",
    "moduleResolution": "node",
    "outDir": "./bin",
    "inlineSourceMap": true,
    "inlineSources": true,
    "target": "es5",
    "typeRoots": [
      "./node_modules/@types"
    ],
    "noUnusedParameters": false,
    "noUnusedLocals": true,
    "noFallthroughCasesInSwitch": true,
    "noImplicitReturns": true,
    "noImplicitAny": false,
    "alwaysStrict": true,
    "allowUnreachableCode": false,
    "pretty": true
  },
  "exclude": [
    "node_modules",
    "**/*.spec.ts"
  ],
  "compileOnSave": false
}
As @vigie already mentioned, changing the source map settings doesn't change anything. My code is still shifted if I'm attaching to the Docker container.
Here my launch.json for attaching to the container (local is the same without localRoot and remoteRoot):
{
    "version": "0.2.0",
    "configurations": [
        {
            "type": "node2",
            "request": "attach",
            "name": "Attach to Docker",
            "address": "localhost",
            "port": 9229,
            "restart": true,
            "localRoot": "${workspaceRoot}",
            "remoteRoot": "/home/doc/app"
        }
    ]
}
Note that the node2 (v6.3+ - Experimental) is important, it won't work with the old one.
from ts-node.
 henioStraszny
commented on May 22, 2024
henioStraszny
commented on May 22, 2024
@arturoarevalo thanks for great solution, I now can confirm working debugging directly from VS Code, plus I could stop transpiling to js.
tsconfig.json:
{
    "compilerOptions": {
        "target": "es6",
        "module": "commonjs",
        "outDir": "dist",
        "lib": [
            "es6",
            "dom"
        ],
        "experimentalDecorators": true,
        "emitDecoratorMetadata": true
    },
    "include": [
        "src/**/*.ts"
    ],
    "exclude": [
        "node_modules"
    ]
}
from ts-node.
 delfinof
commented on May 22, 2024
delfinof
commented on May 22, 2024
The "shift" problem outlined by @Moenomi when debugging with visual studio a ts-node project inside a docker container seems to be related to the fact that vscode expects to have source maps available locally; ts-node instead creates them in the temp cache directory.
I guess this can only be fixed by the vscode team.
from ts-node.
blakeembrey
commented on May 22, 2024
I'm going to close this issue for now, but feel free to continue the discussion. If someone does find a way for this to work reliably with source maps in IDEs, let me know - I'm happy to add it to the README.
from ts-node.
amcdnl
commented on May 22, 2024
@blakeembrey I think it would be good idea to add @giggio to the readme.
from ts-node.
 leoparis89
commented on May 22, 2024
leoparis89
commented on May 22, 2024
I have the following launch.json :
{
    "version": "0.2.0",
    "configurations": [
        {
            "type": "node",
            "request": "launch",
            "name": "Launch via NPM",
            "runtimeExecutable": "npm",
            "windows": {
                "runtimeExecutable": "npm.cmd"
            },
            "runtimeArgs": [
                "run-script",
                "debug"
            ],
            "port": 9229,
            "protocol": "inspector"
        }
    ],
    "compounds": []
}
and
debug script in package.json:
"debug": "ts-node --inspect app.ts"
everything works but I ahve to put debugger at the beginning of my app.ts for the following vscode breakpoints to work... Is there a way to not have to do that ?
from ts-node.
blakeembrey
commented on May 22, 2024
If the above works for others, maybe the _bin.js script could be exposed in a slightly nicer way @blakeembrey ?
Sure. We could follow the Mocha pattern and expose an _ts-node script globally.
from ts-node.
 sinedied
commented on May 22, 2024
sinedied
commented on May 22, 2024
Does anyone successfully made it work with WebStorm? I've read through this post, and I'm still stuck trying to debug properly my app with ts-node :/
EDIT: using a config similar to @dupski I can make it work by using debugger; statement in the code, but it still does not work with breakpoints added from the IDE.
from ts-node.
mccool
commented on May 22, 2024
I just found an even easier option for debugging ts-node with webstorm. Just add a script in your package.json file like
"start": "./node_modules/.bin/ts-node $NODE_DEBUG_OPTION --project src ./src/index.ts
The project flag is described in the readme for ts-node and the last argument is the path to your script to run, in this case it's my express app.
With this you can use control + option + d to start the npm script with webstorm's debugger.
from ts-node.
 Xotabu4
commented on May 22, 2024
Xotabu4
commented on May 22, 2024
For debugging protractorJS tests this works:
        {
            "type": "node",
            "request": "launch",
            "name": "Working thru node",
            "program": "${workspaceFolder}/node_modules/.bin/protractor",
            "args": [
                "./jasminejs/protractor.conf.js",
                "--directConnect=true"
            ],
            "protocol": "inspector",
            "sourceMaps": true,
            "console": "internalConsole",
            "outputCapture": "std"
        }
The only JS file - is protractor.conf.js, and first line - require('ts-node').register();
tsconfig.json:
{
  "compilerOptions": {
    "module": "commonjs",
    "target": "es6",
    "sourceMap": true,
    "inlineSourceMap": true,
    "outDir": "./built"
  },
  "exclude": [
    "node_modules/"
  ]
}
from ts-node.
peternann
commented on May 22, 2024
Can I strongly suggest (/beg) that the 'current, best' way to setup VSCode debugging with ts-node is described in the main README?
VSCode is very widely used for Typescript dev.
ts-node is awesome during dev.
Both working together would be SWEET, but it's BLACK MAGIC to get it going!
There is a TON of partial/old/incorrect information floating around...
An official 'Hello World' debugging setup would give ts-node much more traction with devs I expect... If they can't get it working straight away with step-through debugging - You've lost 80% of folks right there...
Which is to say - I've tried several stated solutions from above, and elsewhere, but can't get breakpoints to work reliably (if at all) with ts-node. I guess I will head down the "tsc --watch" path to get a vague equivalent to ts-node...
@cspotcode - Any chance you could pop up a complete, working 'Hello World' project with debugging support and VSCode config on github? I'll send you $20 for your trouble. Seriously...
from ts-node.
blakeembrey
commented on May 22, 2024
I can check but I'm not sure it should be very complicated to get started. Just add ['-r', 'ts-node/register'] to the default node.js configuration? I don't really use this myself but would accept a PR that adds the example to the README.
from ts-node.
blakeembrey
commented on May 22, 2024
@peternann Can you share the configuration(s) you have tried? Also possible node.js and ts-node versions? I'm not sure how there could be a race condition unless you are using different configuration such as setting your own port. In which case you should check out https://code.visualstudio.com/docs/nodejs/nodejs-debugging since it's all the same, just with two lines added for ts-node/register.
from ts-node.
 s-KaiNet
commented on May 22, 2024
s-KaiNet
commented on May 22, 2024
Just verified it working locally by creating a new project. All I did is below. Can someone confirm this?
Works well for me on node 8.10, however on node 6.x breakpoints never hit. Maybe that's the case for other folks.
from ts-node.
s-KaiNet
commented on May 22, 2024
Works well for me on node 8.10, however on node 6.x breakpoints never hit. Maybe that's the case for other folks.
UPDATE: well, breaks work in an initial file (index.ts for example), however, don't work in all imported files :( (Breakpoint ignored because generate code not found (source map problem) - exactly like @peternann mentioned
from ts-node.
s-KaiNet
commented on May 22, 2024
Created reproduction repository - here:
- Clone,
npm i - Add breaks in
index.tsandparser.ts, F5 -> doesn't work inparser.ts
node 8.10 npm 5.7.1
UPDATE: the funny thing is, that it works exactly the same with generated .js files (break hits in index.js, but not in parser.js). Configuration is below:
{
	"type": "node",
	"request": "launch",
	"name": "node",
	"program": "${workspaceFolder}/lib/index.js",
	"preLaunchTask": "build",
	"sourceMaps": true
},
So now it looks like vscode\TS issue? Or tsconfig should be tweaked... I'm confused
UPDATE2: verified on my old project with [email protected] - the same behaviour, however it worked a few months ago..
UPDATE3: left a comment here as well..
from ts-node.
s-KaiNet
commented on May 22, 2024
So it looks like vscode bug... superannoying!
from ts-node.
s-KaiNet
commented on May 22, 2024
Installed 1.20 from here - everything works! ts-node, node, breaks, everything!
from ts-node.
 Kamilius
commented on May 22, 2024
Kamilius
commented on May 22, 2024
@s-KaiNet nope, it still doesn't work for me though (angular-cli protractor and vscode). Tests are launching, but breakpoints are greyed-out with a message "Breakpoint ignored because generated code not found (source map problem?)".
from ts-node.
s-KaiNet
commented on May 22, 2024
@Kamilius hmmm strange...
Did it work before?
Do you have 1.20 installed?
If the answer is yes to both questions, then I don't know the reason why it's still doesn't work for you. For me, 1.20 automagically fixed all issues.
from ts-node.
 davidwesst
commented on May 22, 2024
davidwesst
commented on May 22, 2024
Just a quick update for people. Looking through the bug mentioned by @s-KaiNet, if you're using VS Code 1.21.1, you will need to follow the workaround.
The fix is in place for the next build, but unless they release a 1.21.2, we won't see the fix until 1.22.
I can confirm that I have everything working as expected in 1.22-insiders with the following launch.json
{
    "version": "0.2.0",
    "configurations": [
        {
            "type": "node",
            "request": "launch",
            "name": "Run Tests",
            "cwd": "${workspaceFolder}",
            "program": "${workspaceFolder}/node_modules/mocha/bin/_mocha",
            "args": [
                "--no-timeouts",
                "--colors",
                "--recursive",
                "--inspect-brk",
                "${workspaceFolder}/test/**/*.spec.ts",
                "--require", "ts-node/register"
            ],
            "stopOnEntry": false,
            "internalConsoleOptions": "openOnSessionStart",
            "sourceMaps": true,
            "protocol": "inspector",
            "outFiles": [
                "${workspaceFolder}/test/**/*.*"
            ]
        }
    ]
}
@Kamilius I suggest trying your project using VS Code Insiders build, just to see if it works as expected.
from ts-node.
Kamilius
commented on May 22, 2024
@s-KaiNet, I don't know if it worked previously, as I've just started writing and running those tests
@s-KaiNet @davidwesst thanks, I am already using insiders version, which is currently Version 1.22.0-insider (1.22.0-insider), also I'm using ts-node inside protractor's onPrepare(). My project is generated using angular-cli and this configuration comes by default:
  onPrepare() {
    require('ts-node').register({
      project: './e2e/tsconfig.e2e.json'
    });
    jasmine.getEnv().addReporter(new SpecReporter({ spec: { displayStacktrace: true } }));
  }
@davidwesst workaround you've suggested, for ts-node users, proposes to reapply all breakpoints, but it doesn't work for me. Breakpoints stay greyed out after reapplying operation.
Here's my launch.json configuration:
  {
      "type": "node",
      "request": "launch",
      "name": "ng e2e",
      "cwd": "${workspaceFolder}/angular",
      "program": "${workspaceFolder}/angular/node_modules/protractor/bin/protractor",
      "protocol": "inspector",
      "args": ["${workspaceFolder}/angular/protractor.conf.js"],
      "stopOnEntry": false,
      "sourceMaps": true,
      "runtimeExecutable": "~/.nvm/versions/node/v7.9.0/bin/node",
      "runtimeVersion": "7.9.0",
      "outFiles": [
        "${workspaceFolder}/**/e2e/**/*.js"
      ]
    }
Version of node is set to 7.9.0, as default 8.9.3 is not launching e2e tests at all, only showing warning:
(node:7523) [DEP0062] DeprecationWarning: `node --debug` and `node --debug-brk` are invalid. Please use `node --inspect` or `node --inspect-brk` instead.
from ts-node.
davidwesst
commented on May 22, 2024
@Kamilius -- My apologies as I didn't see this until just now!
Well, 1.22.1 is already out, so hopefully that resolves the issue in the long-term. The answer I found for the breakpoint thing was you needed to follow the following to "reapply all breakpoints":
- Start your debugger
- Break on first line
- _Now disable and re-enable all breakpoints
- You should hopefully hit the next breakpoint
- Repeat every time you debug
Again, hopefully this is fixed in the new version of Code that is out, but that was my little workaround.
from ts-node.
peternann
commented on May 22, 2024
I am still having no luck with this. I gave up on my old project. Figured it had something weird.
But I'm now on a new project, on a different computer, and a different OS, and having the same troubles.
As requested by @blakeembrey, here is my launch config:
        {
            "type": "node",
            "request": "launch",
            "name": "Launch Program",
            "runtimeArgs": [
                "-r",
                "ts-node/register"
            ],
            "args": [
                "${workspaceFolder}/index.ts"
            ]
        }
Yes, that is byte-for-byte what was suggested.
I am using vscode 1.22.2, on Windows 7.
Using versions: Node=8.10, ts-node=6.0.2, typescript=2.8.3
(Latest at time of writing)
Breakpoints in the top file (index.ts) work fine, (Even though they report "Breakpoint ignored because generated code not found (source map problem?)."
The other breakpoints show the same text on hover, but are grayed out and the breakpoint circle is empty. They go gray as soon as I launch, by the time they hit my test breakpoint in the top file.
The disable/reenable/Reapply All tricks do not work for me.
This is driving me bananas.
Does the contents of tsconfig.json matter? Here's mine right now after minimizing it:
{
    "compilerOptions": {
        "module": "commonjs",
        "target": "es6",
        "outDir": "dist",
    },
    "exclude": [
        "node_modules",
        "**/*.spec.ts"
    ]
}
'tsc' completes happily, silently
Any new ideas out there?
from ts-node.
 iammelvin
commented on May 22, 2024
iammelvin
commented on May 22, 2024
@blakeembrey Thanks for the solution it works !
from ts-node.
 phil294
commented on May 22, 2024
phil294
commented on May 22, 2024
For attaching, the process is pretty much the same. package.json:
"scripts": {
    "dev": "node --inspect $(npm bin)/ts-node index.ts"
and in launch.json the typical
"type": "node",
"request": "attach",
"protocol": "inspector",
 "port": 9229
from ts-node.
 PuzoLiang
commented on May 22, 2024
PuzoLiang
commented on May 22, 2024
Just verified it working locally by creating a new project. All I did is below. Can someone confirm this?
        {
            "type": "node",
            "request": "launch",
            "name": "Launch Program",
            "runtimeArgs": [
                "-r",
                "ts-node/register"
            ],
            "args": [
                "${workspaceFolder}/index.ts"
            ]
        }
thank you very much
from ts-node.
 millsp
commented on May 22, 2024
millsp
commented on May 22, 2024
Hey @blakeembrey, do you know if this is still working correctly?
Because I am able to debug using breakpoints, but in some cases, the breakpoint is just ignored.
This seems to happen when a breakpoint is placed in a file that is not directly run. I also tried to add --nolazy but without success. Should I just transpile?
{
	"launch": {
		"configurations": [
			{
				"name": "Debug Current",
				"type": "node",
				"request": "launch",
				"args": [
					"${fileBasename}"
				],
				"runtimeArgs": [
					"-r",
					"ts-node/register"
				],
				// "sourceMaps": true,
				"cwd": "${fileDirname}",
				"protocol": "inspector",
				"outputCapture": "std",
			},
		],
		"compounds": []
	}
}
EDIT: It does work, if I place a breakpoint in the file that is run, strangely. Any idea?
EDIT: I also tried to do this with the config you provide, and the result is the same.
from ts-node.
millsp
commented on May 22, 2024
nevermind, it seems to be related to microsoft/vscode-chrome-debug-core#533
from ts-node.
 protoEvangelion
commented on May 22, 2024
protoEvangelion
commented on May 22, 2024
Thank you @GuillaumeDesforges I tried like a 1000 different ways and this was the only one that worked for my use case 😓
{
            "name": "runit",
            "type": "node-terminal",
            "request": "launch",
            "command": "ts-node-dev --inspect -T -O '{\"esModuleInterop\": true}' --skip-project my-scripts/migrate.ts my-scripts/a",
            "cwd": "${workspaceFolder}"
},
from ts-node.
Related Issues (20)
- In REPL, can't access the previous line's return value via `_`
- Error when using ts-node with tsonfig/bases and typescript 5.3.2 HOT 3
- "TypeError: require(...) is not a function" in ts-node dependecy
- extends of tsconfig.json doesn't work when it reference to other package HOT 2
- add --env-file environment variable similar to node v:20.6.0 HOT 9
- ERR_UNKNOWN_FILE_EXTENSION since Node.js 18.19.0 (works fine with 18.18.2) HOT 17
- Support clearing the local context with .clear when starting programmatically
- In #!/bin/bash clear apt update apt upgrade apt install figlet -y figlet Basic Installation apt install toilet -y apt install cowsay -y apt install nano -y apt install ruby -y gem install lolcat figlet -f big Done !!! | lolcat echo echo -e "\e[1m Now Run \e[32mbash t-ban.sh\e[0m...!!!" echo echo -e "\e[1m\e[32m Developed by :\e[33m Sutariya Parixit (8h4i)" echo echo( there are Issu for In title The Over view and synonyms Not Seen in his real formet
- ts-node is unable to resolve tsconfig files in Yarn workspace HOT 2
- ESM: Cannot find module './index.js' and requiring "imaginaryUncacheableRequireResolveScript" HOT 1
- TypeError [ERR_UNKNOWN_FILE_EXTENSION]: Unknown file extension ".ts" in Node v21.5.0 HOT 36
- "Cannot find package" when running mocha and importing between packages in monorepo HOT 1
- Can't use `--eval` with ESM
- calling `repl.start()` causes a doubling of stdin/stdout
- ts-node cannot run mixed ESM/CJS project HOT 2
- Cryptic error on invalid tsconfig.json, e.g. if attempting to extend nonexistent tsconfig file
- ts-node doesn't resolve extended tsconfigs if they originate from the export fields of packages
- [Error [ERR_REQUIRE_ESM]: require() of ES Module /.../node_modules/ts-node/esm.mjs not supported. HOT 1
- [DEP0180] DeprecationWarning: fs.Stats constructor is deprecated when using node 22
- Setting emitAssertForImportAttributes no longer works in Node.js 22 with latest swc
Recommend Projects
-
 React
React
A declarative, efficient, and flexible JavaScript library for building user interfaces.
-
Vue.js
🖖 Vue.js is a progressive, incrementally-adoptable JavaScript framework for building UI on the web.
-
 Typescript
TypeScript is a superset of JavaScript that compiles to clean JavaScript output.
-
TensorFlow
An Open Source Machine Learning Framework for Everyone
-
Django
The Web framework for perfectionists with deadlines.
-
 Laravel
A PHP framework for web artisans
-
D3
Bring data to life with SVG, Canvas and HTML. 📊📈🎉
-
Recommend Topics
-
javascript
JavaScript (JS) is a lightweight interpreted programming language with first-class functions.
-
web
Some thing interesting about web. New door for the world.
-
server
A server is a program made to process requests and deliver data to clients.
-
Machine learning
Machine learning is a way of modeling and interpreting data that allows a piece of software to respond intelligently.
-
Visualization
Some thing interesting about visualization, use data art
-
Game
Some thing interesting about game, make everyone happy.
Recommend Org
-
Facebook
We are working to build community through open source technology. NB: members must have two-factor auth.
-
Microsoft
Open source projects and samples from Microsoft.
-
Google
Google ❤️ Open Source for everyone.
-
Alibaba
Alibaba Open Source for everyone
-
D3
Data-Driven Documents codes.
-
Tencent
China tencent open source team.
from ts-node.