Use a machine learning model to predict the 2021 OPS (On-base Plus Slugging) for the entire roster of MLB players and select a full roster of players with the highest OPS for their salary.
OPS Background:
OPS (On-base Plus Slugging) sums a player's on-base percentage and slugging percentage. These two metrics are effectively asking "Does the player get on base?" and "Can he hit?". In summary, how many opportunities does the player create for runs and how successful is he in actually being able to hit? The objective is to utilize a team's offensive statistics to create a lineup with the highest chance of winning. Rather than the traditional scouting approach where there are more qualitative measures of performance such as strength, bat speed, arm extension/follow through, aggression, etc., using these two simple statistics does not require individual analysis of every player and in theory can create a cohesive team by combining compatible players by analyzing their historical performance.
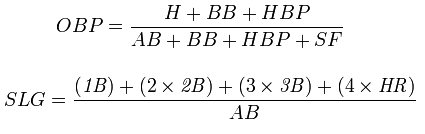
The OPS formula below:
H = Hits - when the batter strikes the ball without error
BB = Walks - when a pitcher throws four pitches out of the strike zone, none of which are swing at by the batter
HBP = Hit by pitch - when a batter is struck by a pitched ball without swinging at it and is awarded first base.
AB = At bat - when a batter reaches base via fielder's choice, hit, or error (not including catcher's interference)
SF = Sacrifice fly - when a batter hits a fly-ball to the outfield or foul territory that allows a runner to score
1B = Single - when batter hits the ball and reaches first base
2B = Double - when batter hits the ball and reaches second base
3B = Triple - when batter hits the ball and reaches third base
HR = Home run - when batter hits the ball and circles all four bases
Model:
Long Short-term memory, recurrent neural network
Model loss functions: Initially tested with binary cross-entropy. Can be penalized for being very confident and very wrong in some cases.
Did more epochs do better? Not necessarily, more epochs trended to more pessimmistic predictions for OPS.
Data and Parameters:
Data:
Used MLB historical game/player data from 2010 through 2020
2021 player salaries
Dropped any players if they had an OPS of 0 in the year they played
Model Performance Evaluation:
Model predictions were slightly conservative due to the unpredictability of OPS
Results for 50 epochs:
1 (pitcher) = P (Starting: Shohei Ohtani, Relief/Close: Will Smith)
2 (catcher) = C PJ Higgins
3 (first baseman) = 1B Ronald Guzman
4 (second baseman) = 2B Max Moroff
5 (third baseman) = 3B Isaac Paredes
6 (shortstop) = SS Gavin Lux
7 (left fielder) = LF Jake Cave
8 (center fielder) = CF Roman Quinn
9 (right fielder) = RF Kyle Garlick
Results for 100 epochs:
1 (pitcher) = P (Starting: Shohei Ohtani, Relief/Close: Will Smith)
2 (catcher) = C PJ Higgins
3 (first baseman) = 1B Ronald Guzman
4 (second baseman) = 2B Max Moroff
5 (third baseman) = 3B Alex Blandino
6 (shortstop) = SS Gavin Lux
7 (left fielder) = LF Jake Cave
8 (center fielder) = CF Roman Quinn
9 (right fielder) = RF Jaylin Davis
Correlation:
In addition to our models and team roster selections, we also explored the correlations between the wins, losses, runs scored, runs allowed, and the run differentials.
Key for heatmap:
W = Wins
L = Losses
RS = Runs Scored
RA = Runs Allowed (every run scored against the defensive team)
Dff = (RS - RA) Run differential
Findings:
We have discovered a strong positive correlation between team wins and run differentials. Run differentials are used to predict the expected win total for a team. If it is positive, a team scores more runs than it allows and negative if it allows more runs than it scores. Generally, the higher a run differential the better. The results below support this since teams with a high (positive) run differential trend toward more wins.