Comments (8)
 microsud
commented on June 14, 2024
microsud
commented on June 14, 2024
Thanks for the query. Which function did you use ? and I don't see the attached heat map 😉
from microbiomeutilities.
 najibveto
commented on June 14, 2024
najibveto
commented on June 14, 2024
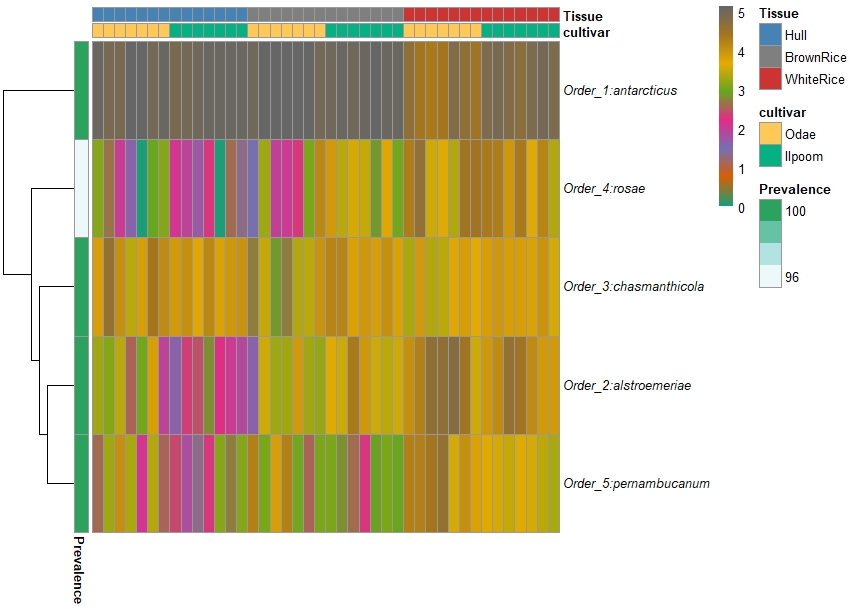
thanks, I use the plot_taxa_heatmap. sorry, i forgot to attach the heat map. I followed the same tutorial.
from microbiomeutilities.
microsud
commented on June 14, 2024
It is not possible at the moment. I will try to re-write this function.
For the other part, you can make a phyloseq object at the level you want and provide it as input.
Try ps.family <- aggregate_taxa(ps0, "Family") to get family level data and use it as input for plotting.
Edit: Does your species column in tax_table(ps) have only species name? If yes you need to merge genus and species to get genus.species.
from microbiomeutilities.
najibveto
commented on June 14, 2024
thanks for your answer. I tried your suggested solution and I got the desired results.
the code I used as below.
I am curious about the use of gsub as in my taxa labeling I don't have the d__denovo, is it possible to omit it? also the label in the plot show two time the family name.
for species, I have only the species names. how to merge genus and species column?
sorry for the trouble.
library(microbiomeutilities)
library(microbiome)
library(knitr)
library(tibble)
library(dplyr)
library(pheatmap)
library(RColorBrewer)
ps = import_biom("RiceOTUN150kp1cleanaddOther.biom", treefilename="RiceOTUreduced.tre", parseFunction= parse_taxonomy_greengenes)
ps
ps.family <- aggregate_taxa(ps, "Family")
taxa_names(ps.family) <- gsub("d__denovo", "OTU:", taxa_names(ps.family))
grad_ab <- colorRampPalette(c("#faf3dd","#f7d486" ,"#5e6472"))
grad_ab_pal <- grad_ab(10)
gray_grad <- colorRampPalette(c("white", "steelblue"))
gray_grad_cols <- gray_grad(10)
meta_colors <- list(c("Odae" = "#FFC857",
"Ilpoom" = "#05B083"),
c("Hull" = "steelblue",
"BrownRice" = "grey50",
"WhiteRice"="brown3"),
gray_grad_cols)
names(meta_colors) <- c("cultivar", "Tissue")
p <- plot_taxa_heatmap(ps,
subset.top = 25,
VariableA = c("cultivar","Tissue"),
heatcolors = grad_ab_pal, #rev(brewer.pal(6, "RdPu")),
transformation = "log10",
cluster_rows = T,
cluster_cols = F,
show_colnames = F,
annotation_colors=meta_colors)
from microbiomeutilities.
microsud
commented on June 14, 2024
Good. I also removed the prevalence option from the plot in latest v1.00.13. For gsub check this primer on the parent microbiome R package website. The duplicate labelling is because you add it with gsub. You can skip it. For merging genus+species, I am not sure how your species column looks like and therefore cannot provide a direct solution. You should be able to find a solution online. If you do, please post it here for others :)
from microbiomeutilities.
najibveto
commented on June 14, 2024
thanks a lot. for the gsub, I omitted but still give double name. the taxa table is as follow (kable(head(tax_table(ps))[3:6])):
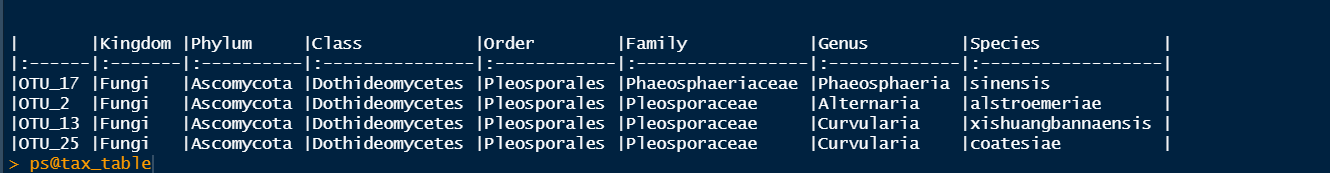 .
.
from microbiomeutilities.
microsud
commented on June 14, 2024
Try this to merge genus.species
library(tibble)
library(dplyr)
tax_tb <- as(tax_table(ps),"matrix") %>%
  as.data.frame() %>%
  rownames_to_column("ASV") %>%
  mutate(Genus.Species = ifelse(!is.na(Species), paste0(Genus, ".", Species), Species)) %>%
  select(-Species)   %>%
rename(Species = Genus.Species)

#tax_tb[1:30, 5:9]
rownames(tax_tb) <- tax_tb$ASV
tax_tb <- tax_tb[,-1]

tax_table(ps) <- tax_table(as.matrix(tax_tb))
from microbiomeutilities.
najibveto
commented on June 14, 2024
thank you a lot for your help. one question if possible, the order in heatmap is fixed based on what? if I want the most abundant to be on the first row, should i modify the function?
from microbiomeutilities.
Related Issues (20)
- get_group_abundances group argument without NULL as default HOT 1
- Error with plot_taxa_cv() HOT 3
- Cannot install microbiomeutilities on R, what to do? HOT 6
- rlang::last_error() HOT 3
- Phy_tree not included in the result of format_to_besthit HOT 2
- Relative abundance plot for selected taxa HOT 5
- Taxonomic levels should be either 6 (untill genus) or 7 (until species) level HOT 1
- Problem to install HOT 6
- Error in `check_aesthetics()`: ! plot_ordination_utils HOT 2
- plot_taxa_barplot - HOT 4
- format_to_besthit edit HOT 1
- double genus name in heatmap HOT 1
- plot_taxa_boxplot error HOT 2
- Taxonomic_Levels Percent_Classification HOT 2
- Unable to change levels of group variable in plot_paired_abundances
- Plot_spaghetti - same results each result-cell. Idea about why?
- Problem to load HOT 1
- A HOT 8
- error with plot_taxa_heatmap
Recommend Projects
-
 React
React
A declarative, efficient, and flexible JavaScript library for building user interfaces.
-
Vue.js
🖖 Vue.js is a progressive, incrementally-adoptable JavaScript framework for building UI on the web.
-
 Typescript
TypeScript is a superset of JavaScript that compiles to clean JavaScript output.
-
TensorFlow
An Open Source Machine Learning Framework for Everyone
-
Django
The Web framework for perfectionists with deadlines.
-
 Laravel
A PHP framework for web artisans
-
D3
Bring data to life with SVG, Canvas and HTML. 📊📈🎉
-
Recommend Topics
-
javascript
JavaScript (JS) is a lightweight interpreted programming language with first-class functions.
-
web
Some thing interesting about web. New door for the world.
-
server
A server is a program made to process requests and deliver data to clients.
-
Machine learning
Machine learning is a way of modeling and interpreting data that allows a piece of software to respond intelligently.
-
Visualization
Some thing interesting about visualization, use data art
-
Game
Some thing interesting about game, make everyone happy.
Recommend Org
-
Facebook
We are working to build community through open source technology. NB: members must have two-factor auth.
-
Microsoft
Open source projects and samples from Microsoft.
-
Google
Google ❤️ Open Source for everyone.
-
Alibaba
Alibaba Open Source for everyone
-
D3
Data-Driven Documents codes.
-
Tencent
China tencent open source team.
from microbiomeutilities.