Comments (10)
 TarekElDick
commented on May 18, 2024
TarekElDick
commented on May 18, 2024
I'm trying to overlay an aerial image above my property to increase quality of the labeling.
from satellite-imagery-labeling-tool.
TarekElDick
commented on May 18, 2024

from satellite-imagery-labeling-tool.
 rbrundritt
commented on May 18, 2024
rbrundritt
commented on May 18, 2024
I'm not able to reproduce this. Ensure that when passing in bounding box information the coordinates are in the format of "west,south,east,west". Also ensure the decimal place of the numbers is a period and not a comma (some language settings use commas) as this will likely result and very large numbers that cover the whole globe.
from satellite-imagery-labeling-tool.
TarekElDick
commented on May 18, 2024
I'm not able to reproduce this. Ensure that when passing in bounding box information the coordinates are in the format of "west,south,east,west". Also ensure the decimal place of the numbers is a period and not a comma (some language settings use commas) as this will likely result and very large numbers that cover the whole globe.
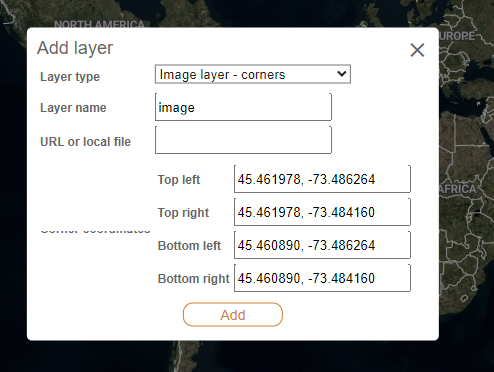
For the load local image as a layer using corners. I input something like this
Which still breaks the map
Based on the format you provided they should be in Based on the coordinates provided, the format you're asking for is "west, south, east, north." Using this format I get.
West: -73.486264
South: 45.460890
East: -73.484160
North: 45.461978
Therefore, the combined format is:
-73.486264, 45.460890, -73.484160, 45.461978
So using that we can get.
Which doesn't work

from satellite-imagery-labeling-tool.
rbrundritt
commented on May 18, 2024
It looks like when using corners you have latitude/longitude reversed. In GIS the common standard is "longitude, latitude" as longitude is often associated with X in the terms of (x,y).
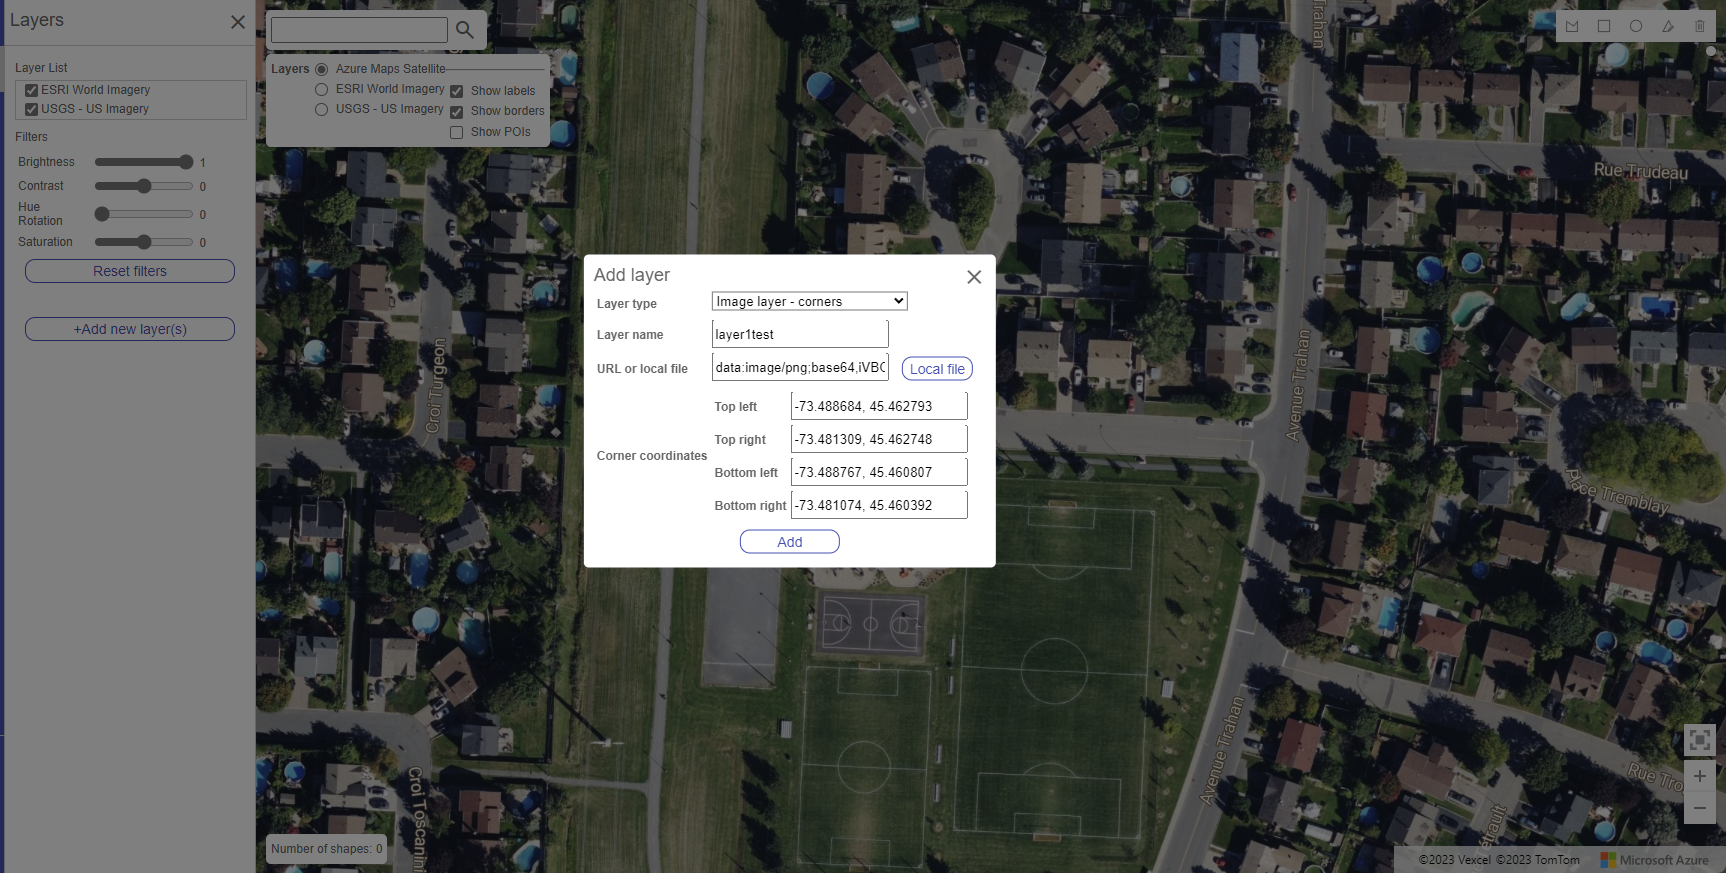
I tried the bounding box coordinates you provided and they correctly showed that layer on the map. Note that the Azure Maps Aerial imagery always renders behind other layers. The primary reason for this is that includes vector labels that power the accessibility (screen reader describes the map as it moves). Note that your bounding box is really small (size of a residential property), so you need to zoom in more to see it. In my test, I was barely able to see the image at this bounding box when zoomed out as much as your last image.
from satellite-imagery-labeling-tool.
TarekElDick
commented on May 18, 2024
Apologies I forgot to mention my mistake earlier. I appreciate the time you have taken to debug my issue. I would like to share my entire workflow to portray my problem and frustration in making an image show up as a layer over the satellite imagery.
- First off the location of the image.
LON, LAT : -73.48521244444444, 45.46143425
LAT, LON: 45.46143425, -73.48521244444444

- Default Annotation Task Initial View

Bounds : −73.488767, 45.460392, −73.481074, 45.462793
Corners:
Top left: -73.488684, 45.462793
Top Right: -73.481309, 45.462748
Bottom Left: -73.488767, 45.460807
Bottom Right: -73.481074, 45.460392
The image is saved locally on my machine, with a filename and type of : screenshot.png. Original image was of type JPEG but I saved a screenshot of it to see if PNG would work for me.
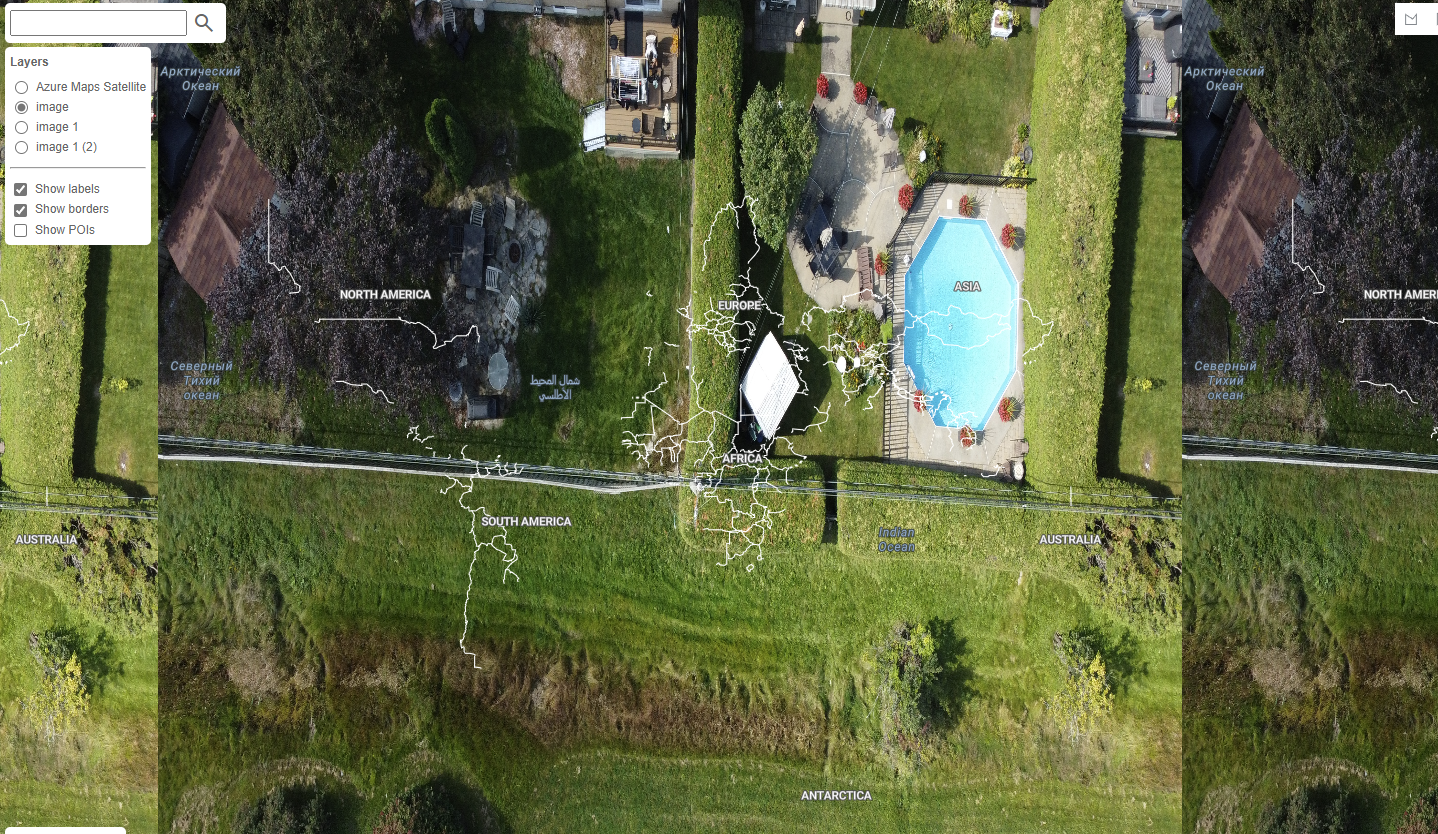
- Attempt to upload image using corners
- Result, the entire map is my image lol.

-
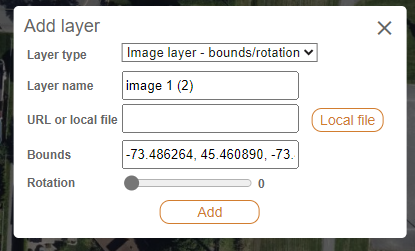
Attempt to upload image using bounds and rotation.

-
Result , nothing shows up

Again I thank you again and I hope you may help me in my task and find my mistake.
Do I need to host the image on a server before being able to upload it ?
Do I need to use different filenames and/or image types ?
Can I see how it looks like when you attempt to recreate my behavior ?
from satellite-imagery-labeling-tool.
rbrundritt
commented on May 18, 2024
Well, this was a frustrating one to debug as it worked fine for me yesterday but had the issue today when I used the information you provided in your last post. The culprit... is that you are using a dash instead of hyphen as a negative sign, and the browsers parseFloat doesn't recognize it as a negative sign, and thus returned NaN, and this tool is failing over to a global bounding box as a result. I'll add some code to handle this odd scenario.
from satellite-imagery-labeling-tool.
TarekElDick
commented on May 18, 2024
OMG thank you so much when using bounds and rotation it works now but for corners it still seems to be finicky for me even after using the correct (-) keyboard input.
from satellite-imagery-labeling-tool.
rbrundritt
commented on May 18, 2024
Ok, think I got it this time. I overlooked a past pull request and missed a mistake that was checked in. Crazy enough the code still worked in some cases, but not in other. Should be corrected now.
from satellite-imagery-labeling-tool.
TarekElDick
commented on May 18, 2024
Can confirm it is working now, thanks !
from satellite-imagery-labeling-tool.
Related Issues (16)
- Consider using Azure Maps for the map control HOT 6
- [Feature] [Labeler] Copy & Paste Annotations HOT 6
- Unable to label a feature as a different secondary class by selecting it on the side-menu in the labeling tool HOT 3
- Way to remove basemaps so only my layer is visible? HOT 1
- Drawn shapes not visibile when using GeoTIFF HOT 5
- Adding a new layer does not work in Project Builder HOT 7
- [Question] Labeling a dataset of a lot of TIFs
- Adjust brightness and contrast of image only HOT 3
- update training-example with 0.4.1 and 0.5.0 releases HOT 1
- Rename `src/overpassScripts/*.txt` to `src/overpassScripts/*.overpassql` HOT 3
- Availability of data/pre/annotations/pre_labels.geojson HOT 3
- On adding a result the project viewer does not open the project HOT 7
- Feature request: lasso delete HOT 3
- Test Service URL not catching bad URL if titiler running HOT 4
- Feature request: Selecting default map layer HOT 1
Recommend Projects
-
 React
React
A declarative, efficient, and flexible JavaScript library for building user interfaces.
-
Vue.js
🖖 Vue.js is a progressive, incrementally-adoptable JavaScript framework for building UI on the web.
-
 Typescript
TypeScript is a superset of JavaScript that compiles to clean JavaScript output.
-
TensorFlow
An Open Source Machine Learning Framework for Everyone
-
Django
The Web framework for perfectionists with deadlines.
-
 Laravel
A PHP framework for web artisans
-
D3
Bring data to life with SVG, Canvas and HTML. 📊📈🎉
-
Recommend Topics
-
javascript
JavaScript (JS) is a lightweight interpreted programming language with first-class functions.
-
web
Some thing interesting about web. New door for the world.
-
server
A server is a program made to process requests and deliver data to clients.
-
Machine learning
Machine learning is a way of modeling and interpreting data that allows a piece of software to respond intelligently.
-
Visualization
Some thing interesting about visualization, use data art
-
Game
Some thing interesting about game, make everyone happy.
Recommend Org
-
Facebook
We are working to build community through open source technology. NB: members must have two-factor auth.
-
Microsoft
Open source projects and samples from Microsoft.
-
Google
Google ❤️ Open Source for everyone.
-
Alibaba
Alibaba Open Source for everyone
-
D3
Data-Driven Documents codes.
-
Tencent
China tencent open source team.
from satellite-imagery-labeling-tool.