Comments (23)
 xiaomi7732
commented on May 21, 2024
xiaomi7732
commented on May 21, 2024
@SWarnberg thanks for reaching us. I am sorry to hear that it doesn't work for you.
Please help me understand your question first.
- There is an expectation the
Enable Profilerin the portal will be there to turn on Service Profiler for ASP.NET Core for Linux, right?
- Unfortunately, for this initial release, we do NOT have any portal experience. That button is used for Service Profiler for Windows.
- Once you update the project and everything is hooked up, you do NOT need to use the
Enable Profilerbutton at all. - We should have stated this clearly in our documentation.
That said, I am interested in why it is not working for your scenario. Could you please help me understand your scenario a bit more:
- Firstly, could you please confirm that your project runs on Linux?
- You said you are not using Dockerfile in the 1st bullet but then mentioned you are adding ASPNETCORE_HOSTINGSTARTUPASSEMBLIES to the Dockerfiler. I am a bit confused. Are you using Dockerfile to build the image or not? Could you please explain in details how is your project get deployed?
- Just as an troubleshooting, could you please add this line to your
Startup.csand redeploy your app:
        // This method gets called by the runtime. Use this method to add services to the container.
        public void ConfigureServices(IServiceCollection services)
        {
            services.AddMvc();
            // Add the following line and redeploy
            services.AddServiceProfiler();
        }
Generate some traffic to your site, wait for 5 to 10 mins, go to 'Performance' blade to see if you have any trace showing up.
Thanks again for filing the issue. Looking forward to hearing back from you soon!
from applicationinsights-profiler-aspnetcore.
 SWarnberg
commented on May 21, 2024
SWarnberg
commented on May 21, 2024
Hi,
thanks for the quick respons. Yes, the project runs on Linux.
I finally got it working. As it seems, the AddServiceProfiler call was the trick.
Let me explain in more detail what my scenario was.
- I have created a ASP.NET Core project in Visual Studio using the template as described here: Visual Studio Tools for Docker.
This gives a Dockerfile and docker-compose project and files, so that I can build and publish the project to my Docker (Linux) container. - Then I have enabled Application Insights Telemetry to the project, as described here: Monitor ASP.NET Core apps.
This basically gives the instrumentation key in the appsettings.json file and the ApplicationInsights reference.
Now, to get the profiler working in my project, I manually added the Profiler nuget package, and did not use the Dockerfile. Also, since the instrumentation key is present in the appsettings.json file, I considered it not to be necessary to add that to the Dockerfile either. The only option I was not sure about was the HOSTINGSTARTUPASSEMBLIES variable. Is it needed in the Dockerfile or not, since there is no corresponding attribute in the appsettings file? However, it didn't matter if it was there or not, the profiling didn't work anyway.
So, after adding the AddServiceProfiler call to the Startup class it finally worked. Maybe that should be elaborated in the instructions? I think many are using Visual Studio as their preferred tool for developing .NET Core project, with the built-in templates.
from applicationinsights-profiler-aspnetcore.
SWarnberg
commented on May 21, 2024
However, it seems a bit unstable. Many times when I have a trace i Azure, I get the "Issue loading trace" error message. Any idea?
from applicationinsights-profiler-aspnetcore.
SWarnberg
commented on May 21, 2024
Another question. Is it supposed to work when I publish my project to Azure App Service? Most important for me is to be able to profile in production. As of now, I can't see any traces.
from applicationinsights-profiler-aspnetcore.
xiaomi7732
commented on May 21, 2024
@SWarnberg
Thanks for posting the update and I am glad to hear it starts to work for you. It is a good point that users use Visual Studio templates and I'll see what I can do there.
To answer your questions:
- Yes, it works in Azure App Service as long as it works locally & deployed as Linux App Service; We understand it is a key scenario to profiling the production with little overhead as possible.
- When you see 'Issue Loading Trace', there shall be a short random id (like:
ij35kst) along with it, could you please provide the id (Or maybe a few ids)? With that, I can take a look at what is happening on the service end.
Question for you: Does it fail for every session or does it fail from time to time?
Now, the consideration of using environment variables instead of the calling of code is there to avoid interference with your application logic. We appreciate your feedback and I will look into why it is not working in your scenario.
from applicationinsights-profiler-aspnetcore.
xiaomi7732
commented on May 21, 2024
@SWarnberg Just for your reference, another example is added for the project created in VS:
https://github.com/Microsoft/ApplicationInsights-Profiler-AspNetCore/tree/master/examples/EnableServiceProfilerInVS
from applicationinsights-profiler-aspnetcore.
SWarnberg
commented on May 21, 2024
Thanks. The new guide looks great.
- I haven't seen it working yet, but I will test some more and keep monitoring. During development and testing it's a bit awkward to have to wait so long before anything is published.
- You can look at id qlaef24i.
I really miss the profiling tools that we have with .NET Framework, being able to profile a unit test locally, giving direct hints about performance problems early. But that's another project I believe.
from applicationinsights-profiler-aspnetcore.
SWarnberg
commented on May 21, 2024
Btw; you're not mentioning the AddServiceProfile call in the Startup class. Is it not needed?
from applicationinsights-profiler-aspnetcore.
SWarnberg
commented on May 21, 2024
Update: I have followed the new guide for publishing to Azure, including adding the variables to the Application Settings page. However, after two restarts and waiting over 20 mins each, I still don't get any profiling data in the portal.
from applicationinsights-profiler-aspnetcore.
xiaomi7732
commented on May 21, 2024
@SWarnberg Thanks for the update and the questions. This is going to be long, I want to explain it clearly. please stay with me.
-
Trace error for
qlaef24i.- I checked the service. The trace is gathered and uploaded but there seems no proper activities in the trace.

- Could you please use the 'Download .etl trace' button to download the trace and send it over to [email protected]? Please prefix the title with ServiceProfilerLinux. I need to take a look at the trace to address where the problem is.
- At the same time, if you do the trace again, chances are, it will work - there is nothing wrong on your side for this scenario - the pipeline is up and running already.
- I checked the service. The trace is gathered and uploaded but there seems no proper activities in the trace.
-
About calling AddServiceProfile() and setting ASPNETCORE_HOSTINGSTARTUPASSEMBLIES
- Yes, you are right, in the documentation, there is no calling into AddServiceProfiler(). It is intentional because:
- Put it simply, when there is ASPNETCORE_HOSTINGSTARTUPASSEMBLIES=Microsoft.ApplicationInsights.Profiler.AspNetCore set, it is equivalent to call AddServiceProfiler().
- From the telemetry data, I believe you did both:
- Called AddServiceProfiler(), at the same time:
- Set the environment variable
Could you please confirm that? I think we have a bug there that even if you set at both places, only 1 service profiler should be enabled. Currently, I am seeing both try to get the data but stepped on each other. This could very well be the reason you don't see the data lately.
-
Following the steps in the Enable Service Profiler for ASP.NET Core application in Visual Studio until the point before the step of Publish to App Service, do you see Service Profiler working in the Output window? Especially, do you see logs like this:
Service Profiler session finished. Samples: 14
Tips: when focused in Output Window, use Ctrl+F to search.
If you can see that in the local debugging, the trace will show up in the performance blade later.
-
When you say you miss the profiling tools, are you referencing the Profiling tools with charts and so on integrated with Visual Studio? Could you please elaborate what are the parts that you wish to have?
-
Not able to see the trace is frustrated. We are trying to coming up with a troubleshooting document. Here are some rough steps you might take advantage now to a deployed App Service:
- Enable ServiceProfiler logging level to
InformationorDebugin appsettings.json
- Enable ServiceProfiler logging level to
{
  "Logging": {
    "IncludeScopes": false,
    "LogLevel": {
      "Default": "Warning",
      "ServiceProfiler": "Information"
    }
  },
}-
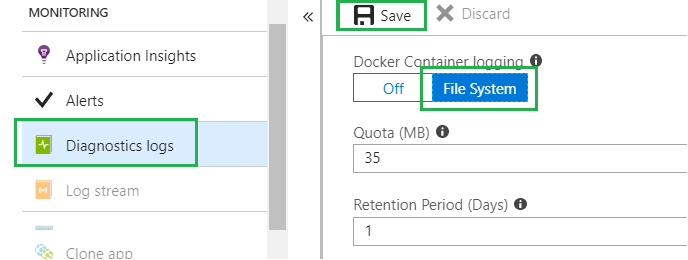
- Enable docker image log in Diagnostics blade for the App Service
- Redeploy the service.
- Tips: Service Profiler will run for 2 minutes when the app restarts. Try to generate some traffic in that period.
- Configure an availability test in the Application Insights resource to always having some traffic for given url.
- If the window is missed and you want to retry, consider stop and start the App Service.
- Enable docker image log in Diagnostics blade for the App Service
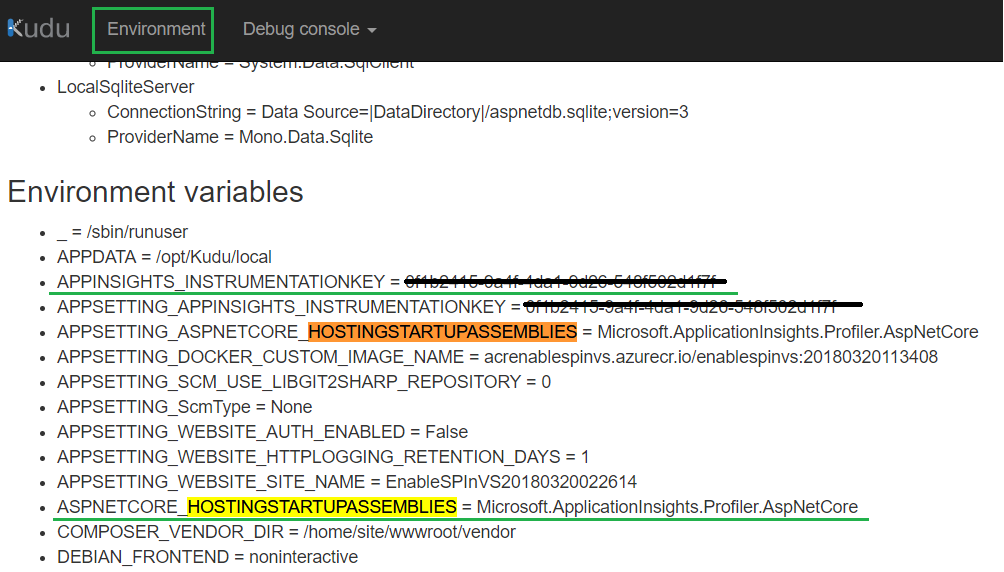
- Bring up
Advanced Toolsin the portal for the App Service:

- In Environment tab, making sure hosting start up and application insights instrumentation key is set:
- Download the logs for the container:

- Search for logs that start with
ServiceProfiler. Send the log to [email protected] if you need help understanding the logs.
- Search for logs that start with
Sorry for this long writing. We really wish this could help you start the Profiling. Thanks!
from applicationinsights-profiler-aspnetcore.
SWarnberg
commented on May 21, 2024
Hi,
thanks for the elaborated answer. Here's my response:
- The old, referenced, trace was gone now, but I managed to reproduce the issue. Reference correlation id: padklzao. However, there is no Download trace button available in the "Issue Loading Trace" view.
- Yes, I did have both AddServiceProfiler and the environment variable in my project. I removed the AddServiceProfiler call and debugged it locally now. I get the Service Profiler logs in the output window, including the following:
Service Profiler session finished. Samples: 4
ServiceProfiler.EventPipe.Client.Schedules.TraceSchedule:Information: Service Profiler session finished. Samples: 4
Application Insights Telemetry: ....
ServiceProfiler.EventPipe.Client.TraceUploader.TraceUploaderProxy[0]
Finished calling trace uploader. Exit code: 0
ServiceProfiler.EventPipe.Client.TraceUploader.TraceUploaderProxy:Information: Finished calling trace uploader. Exit code: 0
However, all 4 samples gives me the "Issue Loading Trace" error.
- Next step I published it again to Azure and verified that the environment variables were there and enabled logging as suggested. I then restarted the service and added some traffic. After that I waited for 15 minutes, and then I got some instrumentation data. However, none of the traces can be opened. The downloaded log may have some hints about that:
Service Profiler session started.
2018-03-22T15:39:58.843634391Z �[40m�[32minfo�[39m�[22m�[49m: ServiceProfiler.EventPipe.Client.EventListeners.TraceSessionListener[0]
2018-03-22T15:39:58.843696093Z       There is no matched start activity found for this activity: id /#1503500717/, relatedActivity: //1/2/
2018-03-22T15:39:58.847592609Z �[40m�[32minfo�[39m�[22m�[49m: ServiceProfiler.EventPipe.Client.EventListeners.TraceSessionListener[0]
2018-03-22T15:39:58.847614509Z       There is no matched start activity found for this activity: id /#1503500717/, relatedActivity: //1/3/
2018-03-22 15:46:00.369 INFO  - Container logs
2018-03-22T15:45:59.026347113Z �[40m�[32minfo�[39m�[22m�[49m: ServiceProfiler.EventPipe.Client.Schedules.TraceSchedule[0]
2018-03-22T15:45:59.028758384Z       Service Profiler session finished. Samples: 5
2018-03-22 15:46:15.251 INFO  - Container logs
2018-03-22T15:46:12.833699305Z �[40m�[32minfo�[39m�[22m�[49m: ServiceProfiler.EventPipe.Client.TraceUploader.TraceUploaderProxy[0]
2018-03-22T15:46:12.833747106Z       Finished calling trace uploader. Exit code: 0
- Regarding the profiling tools, you're right. It's the built in tools in Visual Studio, like the Performance Hub (Analyze-Performance Profiler), which only supports CPU sampling, and especially right-click a Unit Test and select Profile Test, which has been reported in many places, like https://developercommunity.visualstudio.com/content/problem/145926/profile-test-fails-on-net-core-xunit-test-due-to-u.html.
from applicationinsights-profiler-aspnetcore.
SWarnberg
commented on May 21, 2024
I restarted the service once again and got 18 new samples that was uploaded. None of them worked. In the service log file, I see only one entry of "There is no matched start activity found..", so it does not correlate with the number of samples.
from applicationinsights-profiler-aspnetcore.
xiaomi7732
commented on May 21, 2024
@SWarnberg Thanks for the info. Checking from the last telemetry entries, I think you are doing all things correctly. I had applied permission to get one of the trace uploaded. It doesn't, in fact, include the samples that expected - although they are recognized as samples according to the log. There are 2 possibilities:
- They are valid samples, but somehow we didn't get them correct in the trace file;
- They are not valid samples, somehow we recognized them by mistake as samples;
At this stage, is it possible to educate me what is your code doing?
- Maybe paste a piece of example code?
- Maybe, if you upload your container, is it possible to share the container with us?
from applicationinsights-profiler-aspnetcore.
SWarnberg
commented on May 21, 2024
I'll see what I can do tomorrow (it's evening in Sweden :-)), regarding the sample. It's a quite big project, but maybe I can give small pieces. About sharing container, how is that done?
Another thing; I remember it worked one time when I debugged it locally, and at that time I used the AddServiceProfiler method instead of the variable. Could that have any impact?
from applicationinsights-profiler-aspnetcore.
xiaomi7732
commented on May 21, 2024
@SWarnberg , I really appreciate your effort on this.
-
Using AddServiceProfiler() instead is a good point. When you say it worked, do you mean you see the trace from the portal? Please try this:
a. Remove the environment variable ofASPNETCORE_HOSTINGSTARTUPASSEMBLIES.
b. Add back the call to EnableServiceProfiler() in Startup.cs
c. Redeploy the service.
Give it a shoot. If that works for you from end to end, it will help us isolate the issue down to the hosting startup. -
With regarding the sample code, if you can give me some code + description, it will be helpful as well: like what is the project type (ASP.NET Form app? MVC? WebApi?). What is the typical method that your will be interested in to get the performance upon, what are they look like - maybe some example here & there. If it is a MVC, is it possible to share a piece of code for one controller?
-
If you are OK to share the docker image, it will also help us understand your scenario. Please run the following command as Administrator:
docker save -o output.tar imageid:tag
Then upload output.tar to maybe OneDrive any cloud storage you used. Send us the share link to [email protected]
from applicationinsights-profiler-aspnetcore.
SWarnberg
commented on May 21, 2024
Hi,
I did as you suggested and removed the variable and added back AddServiceProfiler, re-deployed and tested. The traces get uploaded. However, they are still not loaded. This time, though, it takes extremely long time in the "Unpacking ETL file" stage:

See correlation id xi1bbcub.
The project is a ASP.NET Core MVC Web Api project. It's integrating with Redis, SQL Server and files, so it's quite heavy. We do have very simple controllers as well, which is part of my tests. For instance, the SettingsController below, for which the above trace was called.
 	[Produces("application/json")]
	[Route("Settings")]
	public class SettingsController : Controller
	{

		ServerSettings _settings;

		public SettingsController(IOptions<ServerSettings> settings)
		{
			_settings = settings.Value;
		}

		[HttpGet]
		public ServerSettings Get()
		{
			return _settings;
		}

	}
from applicationinsights-profiler-aspnetcore.
xiaomi7732
commented on May 21, 2024
@SWarnberg quick question. You mentioned your operation is heavy. Can you give me an idea how much time will an operation take? Thanks!
from applicationinsights-profiler-aspnetcore.
SWarnberg
commented on May 21, 2024
I didn't really mean heavy in that sense. More heavy in code and hard to share.
However, that's also true, an uncached operation may sometimes take up to 6 seconds.
Btw; I did a new deploy with refactored code (replaced a lot of IDistributedCache/Redis calls with IMemoryCache), and removed AddServiceProfiler and re-added the environment variable. This time the traces could be read.
I have no idea whether why it worked this time. Seems strange that it has to do with the refactored code since the SettingsController is untouched. It simply seems unstable.
from applicationinsights-profiler-aspnetcore.
xiaomi7732
commented on May 21, 2024
Hey @SWarnberg With your info about the project, I did some investigation.
Firstly, I agree there is robustness issue here. I could reproduce your scenarios from time to time on my end. We will work on making it more stable.
Secondly, the timeout issue is a known issue in our service end. We have a fix for it but it will take some time to roll out the fix. It does NOT suppose to happen every time.
At the same time, I see you have service that kept doing the profiling but there is no activity (No traffic to your api) during the profiling sessions. Could you please set up an available test for your settings api like this:
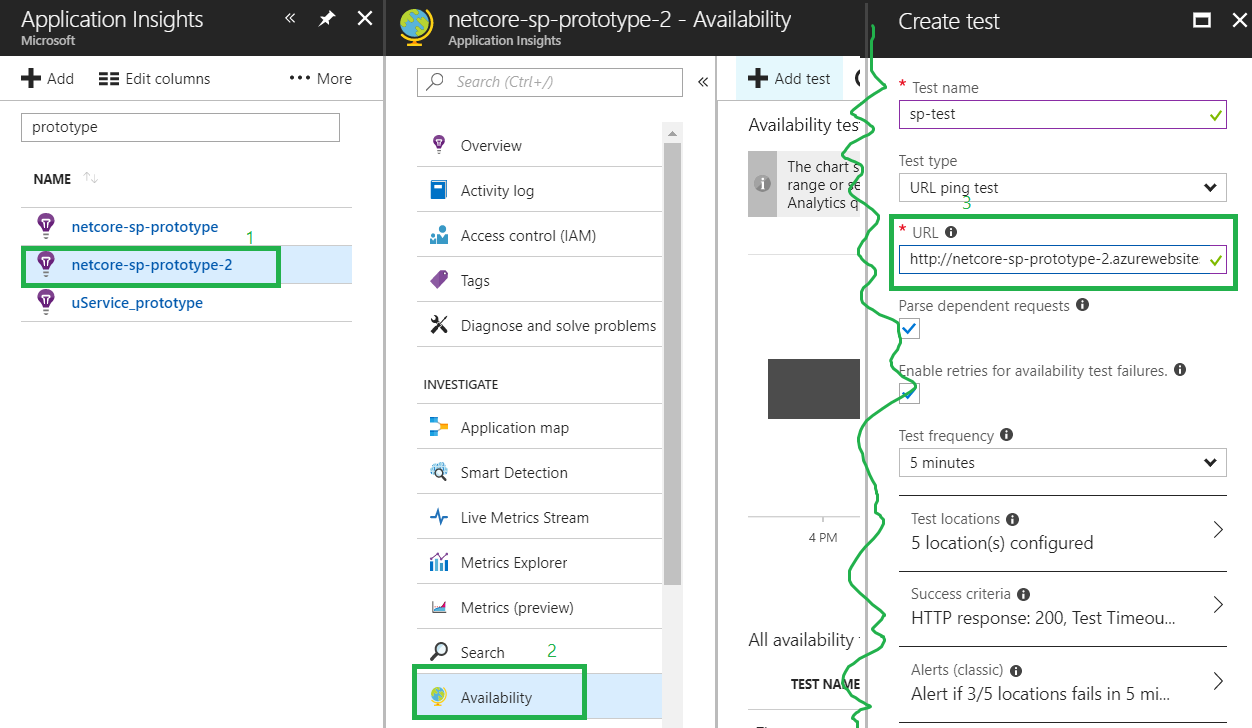 and leave the service running for a few hours to see if you can get valid trace eventually?
Again, we will look into the stable issue anyway but it will take a while. We hope you can get some useful trace out at the same time.
from applicationinsights-profiler-aspnetcore.
SWarnberg
commented on May 21, 2024
Sounds good that you can reproduce it now, and that you can work on a solution.
I have set up an availability test on the service now, so let's see if I get any traces in the next few hours. Question is whether the tests will hit the trace timespan, since the frequency is set to 5 mins and trace is enabled for 2 mins every hour....
from applicationinsights-profiler-aspnetcore.
xiaomi7732
commented on May 21, 2024
@SWarnberg 👍 thank you for setting up the availability test. It will hit eventually.
from applicationinsights-profiler-aspnetcore.
SWarnberg
commented on May 21, 2024
The result from the availability tests was not as good as you could have hoped. A few hours after the test was added, there were still no traces. Then I restarted the container, and just after that I got three traces. However, during the next coming hours, there were no more traces at all.
Now I have disabled the tests because the funds are running out :-)
from applicationinsights-profiler-aspnetcore.
xiaomi7732
commented on May 21, 2024
@SWarnberg Really appreciate your effort! This is really helpful feedback for us. Stabilization will be the next big topic for the next release.
from applicationinsights-profiler-aspnetcore.
Related Issues (20)
- Add RepositoryUrl to NuSpecs so that package could be pushed into github NuGet Repo HOT 1
- Application Insights Profiler causing high memory usage HOT 6
- visual studio and docker-compose not working. HOT 2
- Repeated "Instrumentation Key is empty." error messages in logs since v2.5.0 HOT 8
- Worker service sometimes hangs at profiler startup HOT 4
- The scheduling policy of OneTimeSchedulingPolicy is not registered to an orchestrator. HOT 5
- User report: Memory usage is almost always > 90% on Linux, investigate why HOT 9
- This repo is missing important files
- Could not get the stamp id. Aborting the upload process HOT 15
- [Feature] Handle throttling of 429 better
- Trace file is left when the process crashed before stopping the profiling HOT 5
- The EventPipe Profiler doesn't work with Azure Function (App Service Plan)
- Remove the support of SkipUpload
- EventPipe session was not disposed upon stopping exception
- How-To Use it Properly with OpenTelemetry NuGet? HOT 1
- Please Update Examples To Use APPLICATIONINSIGHTS_CONNECTION_STRING Instead of APPINSIGHTS_INSTRUMENTATIONKEY
- Reduce dependency logging for certain API calls HOT 1
- Profiler throws error in trace: AI: Process was called on the TelemetrySink after it was disposed HOT 2
- Role name in application insights profile list HOT 6
- Bump up the target framework for the uploader to .NET 6
Recommend Projects
-
 React
React
A declarative, efficient, and flexible JavaScript library for building user interfaces.
-
Vue.js
🖖 Vue.js is a progressive, incrementally-adoptable JavaScript framework for building UI on the web.
-
 Typescript
TypeScript is a superset of JavaScript that compiles to clean JavaScript output.
-
TensorFlow
An Open Source Machine Learning Framework for Everyone
-
Django
The Web framework for perfectionists with deadlines.
-
 Laravel
A PHP framework for web artisans
-
D3
Bring data to life with SVG, Canvas and HTML. 📊📈🎉
-
Recommend Topics
-
javascript
JavaScript (JS) is a lightweight interpreted programming language with first-class functions.
-
web
Some thing interesting about web. New door for the world.
-
server
A server is a program made to process requests and deliver data to clients.
-
Machine learning
Machine learning is a way of modeling and interpreting data that allows a piece of software to respond intelligently.
-
Visualization
Some thing interesting about visualization, use data art
-
Game
Some thing interesting about game, make everyone happy.
Recommend Org
-
Facebook
We are working to build community through open source technology. NB: members must have two-factor auth.
-
Microsoft
Open source projects and samples from Microsoft.
-
Google
Google ❤️ Open Source for everyone.
-
Alibaba
Alibaba Open Source for everyone
-
D3
Data-Driven Documents codes.
-
Tencent
China tencent open source team.
from applicationinsights-profiler-aspnetcore.