Comments (7)
 leebyron
commented on June 3, 2024
leebyron
commented on June 3, 2024
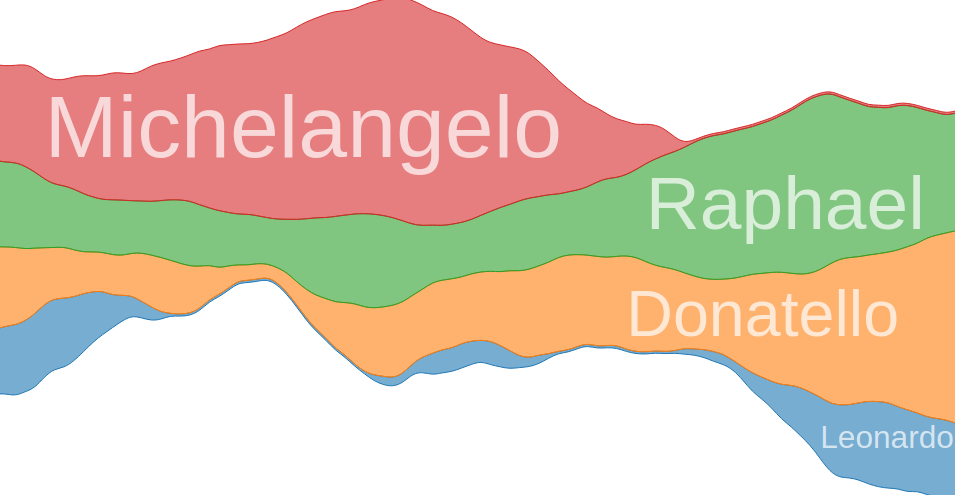
A brute force technique was used for these labels, assuming a single line of text a size of the bounding box for text can be known, then a largest box of the same proportion is searched for within the labeled shape by looking at many possible locations and using the largest found, then the text is drawn in those coordinates
from streamgraph.
 curran
commented on June 3, 2024
curran
commented on June 3, 2024
Thanks for your response!
Do you know of any Open Source implementation available? I'm not able to track down the Listening History project code with the labeling, is it available?
There's still a lot to infer from your description. I think you're suggesting an algorithm like this to label a single area (StreamGraph layer):
- Pick a starting font size.
- Measure the bounding box of the label text.
- Superimpose an M by N grid of possible (x, y) positions for the top left corner of the bounding box on the area, and test whether the bounding box fits within the area for each of those points.
- If there is at least one grid point where the bounding box fits, increase the font size by a constant factor and go back to the first step.
There are a number of constants involved:
- Initial font size
- M and N (grid size for searching)
- Factor by which to scale the font size on each iteration
There's also the problem of implementing the rectangle-in-polygon test (which may be simplified by the fact that the bounding lines are monotonic in X and nonintersecting).
Does this match with your description?
There could be an approach using randomness as well, rather than a grid. Another thought is that maybe simulated annealing could work.
I think there's a great opportunity here for introducing a new library. All of the StreamGraph examples with D3 don't have labels, except this one by @veltman, which implements a label position search for a fixed font size.

http://blockbuilder.org/search#text=streamgraph
I'd argue that the lack of an Open Source solution to StreamGraph label placement is the primary factor that's limiting mainstream adoption of the StreamGraph visualization technique.
from streamgraph.
leebyron
commented on June 3, 2024
As far as I'm aware, there's no open source implementation of this labeling strategy.
Your algorithm sounds like it will work, though I can think of a couple ways to speed it up:
First, the aspect ratio of a label will be the same regardless of font size, so rather than stepping through font sizes, just find the largest rectangle of the aspect ratio that fits and derive the font size from there. That also allows for setting some padding against the edges of the shape, or centering a label if you want a maximum label size.
Second, rather than using a grid of starting points, just use points along the top edge of the shape, assuming a largest fitting rectangle would always have corners that touch the edges of the containing shape.
Those should reduce the search from N^3 points to N points
from streamgraph.
curran
commented on June 3, 2024
Cheers! Fantastic ideas. Thank you so much for your suggestions.
I dug a little deeper and here's what I've found in terms of prior art:
- Chart.Streamgraph (repository) has an implementation of label placement, but it doesn't look like it finds the optimal placement (e.g. "Corn" here could be moved to the right).

- Streamgraph label positions bl.ock by Noah Veltman Does a great job at label placement, but is single-scale only.

- TechCrunch Analysis by @Jeff-Clark implements StreamGraph label positioning, but unfortunately his code is not Open Source.

Will report back here if I get anything working.
from streamgraph.
curran
commented on June 3, 2024
Greetings,
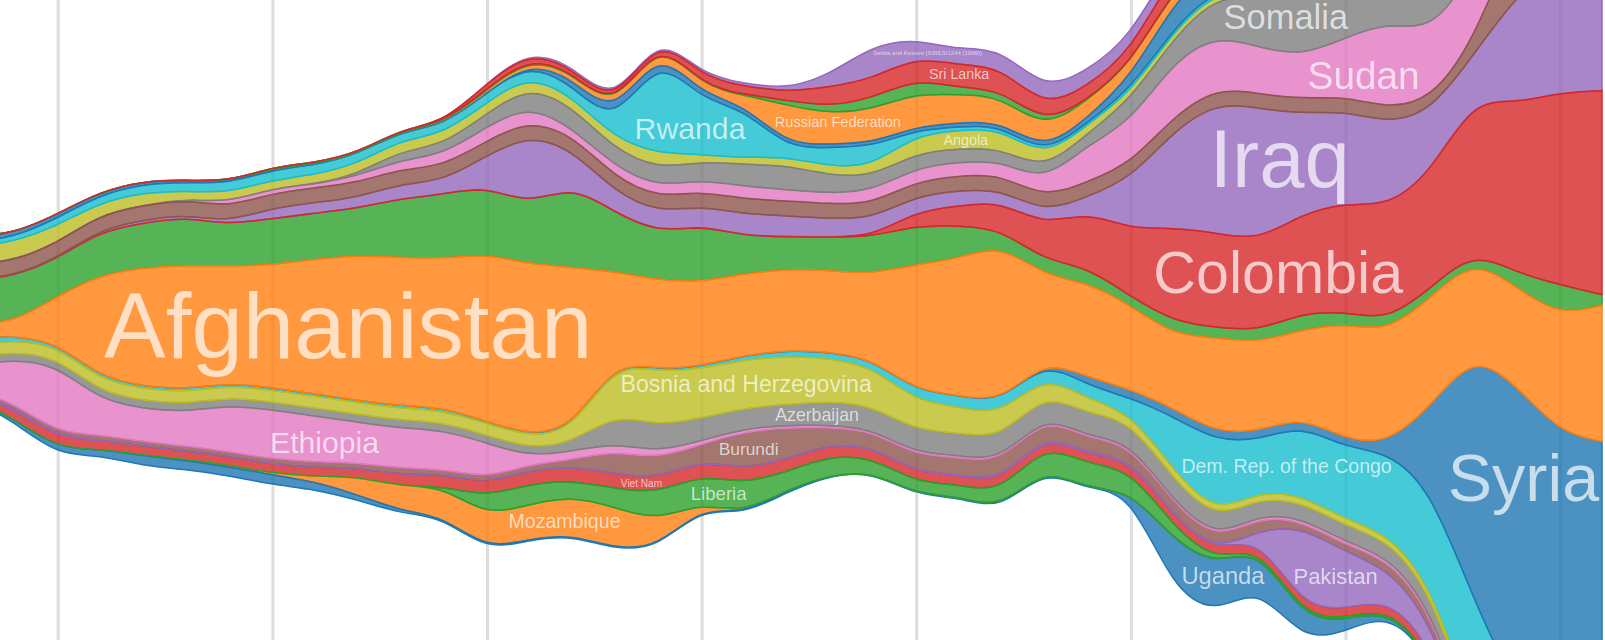
I've implemented a label placement algorithm and released it as a library.
https://github.com/curran/d3-area-label
It uses the Bisection Method and Linear Interpolation to search for the maximum label scale.
Here are some results using it:
It might be cool to add a link to this page http://leebyron.com/streamgraph/
from streamgraph.
leebyron
commented on June 3, 2024
Nice work! If you add a small pull request to do so I'd be happy to take a look https://github.com/leebyron/streamgraph/tree/gh-pages
from streamgraph.
curran
commented on June 3, 2024
@leebyron Thanks for welcoming the addition! I've submitted two PRs:
- Add d3-area-label link #4
- Update d3.stack link #5 - Figured why not while I'm at it.
from streamgraph.
Related Issues (2)
Recommend Projects
-
 React
React
A declarative, efficient, and flexible JavaScript library for building user interfaces.
-
Vue.js
🖖 Vue.js is a progressive, incrementally-adoptable JavaScript framework for building UI on the web.
-
 Typescript
TypeScript is a superset of JavaScript that compiles to clean JavaScript output.
-
TensorFlow
An Open Source Machine Learning Framework for Everyone
-
Django
The Web framework for perfectionists with deadlines.
-
 Laravel
A PHP framework for web artisans
-
D3
Bring data to life with SVG, Canvas and HTML. 📊📈🎉
-
Recommend Topics
-
javascript
JavaScript (JS) is a lightweight interpreted programming language with first-class functions.
-
web
Some thing interesting about web. New door for the world.
-
server
A server is a program made to process requests and deliver data to clients.
-
Machine learning
Machine learning is a way of modeling and interpreting data that allows a piece of software to respond intelligently.
-
Visualization
Some thing interesting about visualization, use data art
-
Game
Some thing interesting about game, make everyone happy.
Recommend Org
-
Facebook
We are working to build community through open source technology. NB: members must have two-factor auth.
-
Microsoft
Open source projects and samples from Microsoft.
-
Google
Google ❤️ Open Source for everyone.
-
Alibaba
Alibaba Open Source for everyone
-
D3
Data-Driven Documents codes.
-
Tencent
China tencent open source team.
from streamgraph.