Comments (22)
 ethanopp
commented on June 14, 2024
4
ethanopp
commented on June 14, 2024
4
Opening up the code if you guys are interested in the charts:
https://github.com/ethanopp/fitly
from sweatpy.
ethanopp
commented on June 14, 2024
1
Thanks will do!
from sweatpy.
ethanopp
commented on June 14, 2024
After playing with this a little more and looking at some of the test cases, I think I may have figured this out... However am still a little confused from the results
def test():
    session, engine = db_connect()
    df = pd.read_sql(
        sql=session.query(stravaSamples.time.label('time'),
                          stravaSamples.heartrate, stravaSamples.cadence,
                          stravaSamples.velocity_smooth.label('speed'),
                          stravaSamples.watts.label('power')).filter(
            stravaSamples.type == 'Ride',
            stravaSamples.activity_id == '3110471562',
        ).statement, con=engine)

    wdf = WorkoutDataFrame(df)
    mmp = pd.Series(wdf.compute_mean_max_power(), name='mmp')
    # Update time index so it starts at 1 second (instead of 0)
    mmp.index += 1

    # Run CP model
    model = '3_parameter_non_linear'
    time_axis = mmp.index
    max_efforts = mmp
    fitted_params = critical_power.model_fit(
        time_axis,
        max_efforts,
        model=model)

    print(fitted_params)
    print(mmp.max())
Backend TkAgg is interactive backend. Turning interactive mode on.
{'cp': 165.992767580866, 'w_prime': 39044.511162117335, 'p_max': 312.04239353700245}
342.0
Why is p_max (returned from the model 312) not the same as the actual power max from the df (342)?
from sweatpy.
ethanopp
commented on June 14, 2024
@AartGoossens hope you may be able to chime in on the above? I’m sure it’s something silly I’m doing... thanks!
from sweatpy.
 AartGoossens
commented on June 14, 2024
AartGoossens
commented on June 14, 2024
Hi Ethan,
Great to hear that you're using this library. :)
Your first error (first message) is indeed caused by the missing CP for the athlete.
The CP (and W' for that matter) are generally computed from a small number of maximal efforts. These efforts are then fitted to a critical power model (e.g. the "3 parameter non linear model" you are using in your second message).
The reason that the p_max that the model is returning is different from the actual power max is because this is the fitted model parameter which represents the interception of the critical power model with the vertical axis (t=0). Here's an visual representation of both the 2-parameter and 3-parameter critical power models:
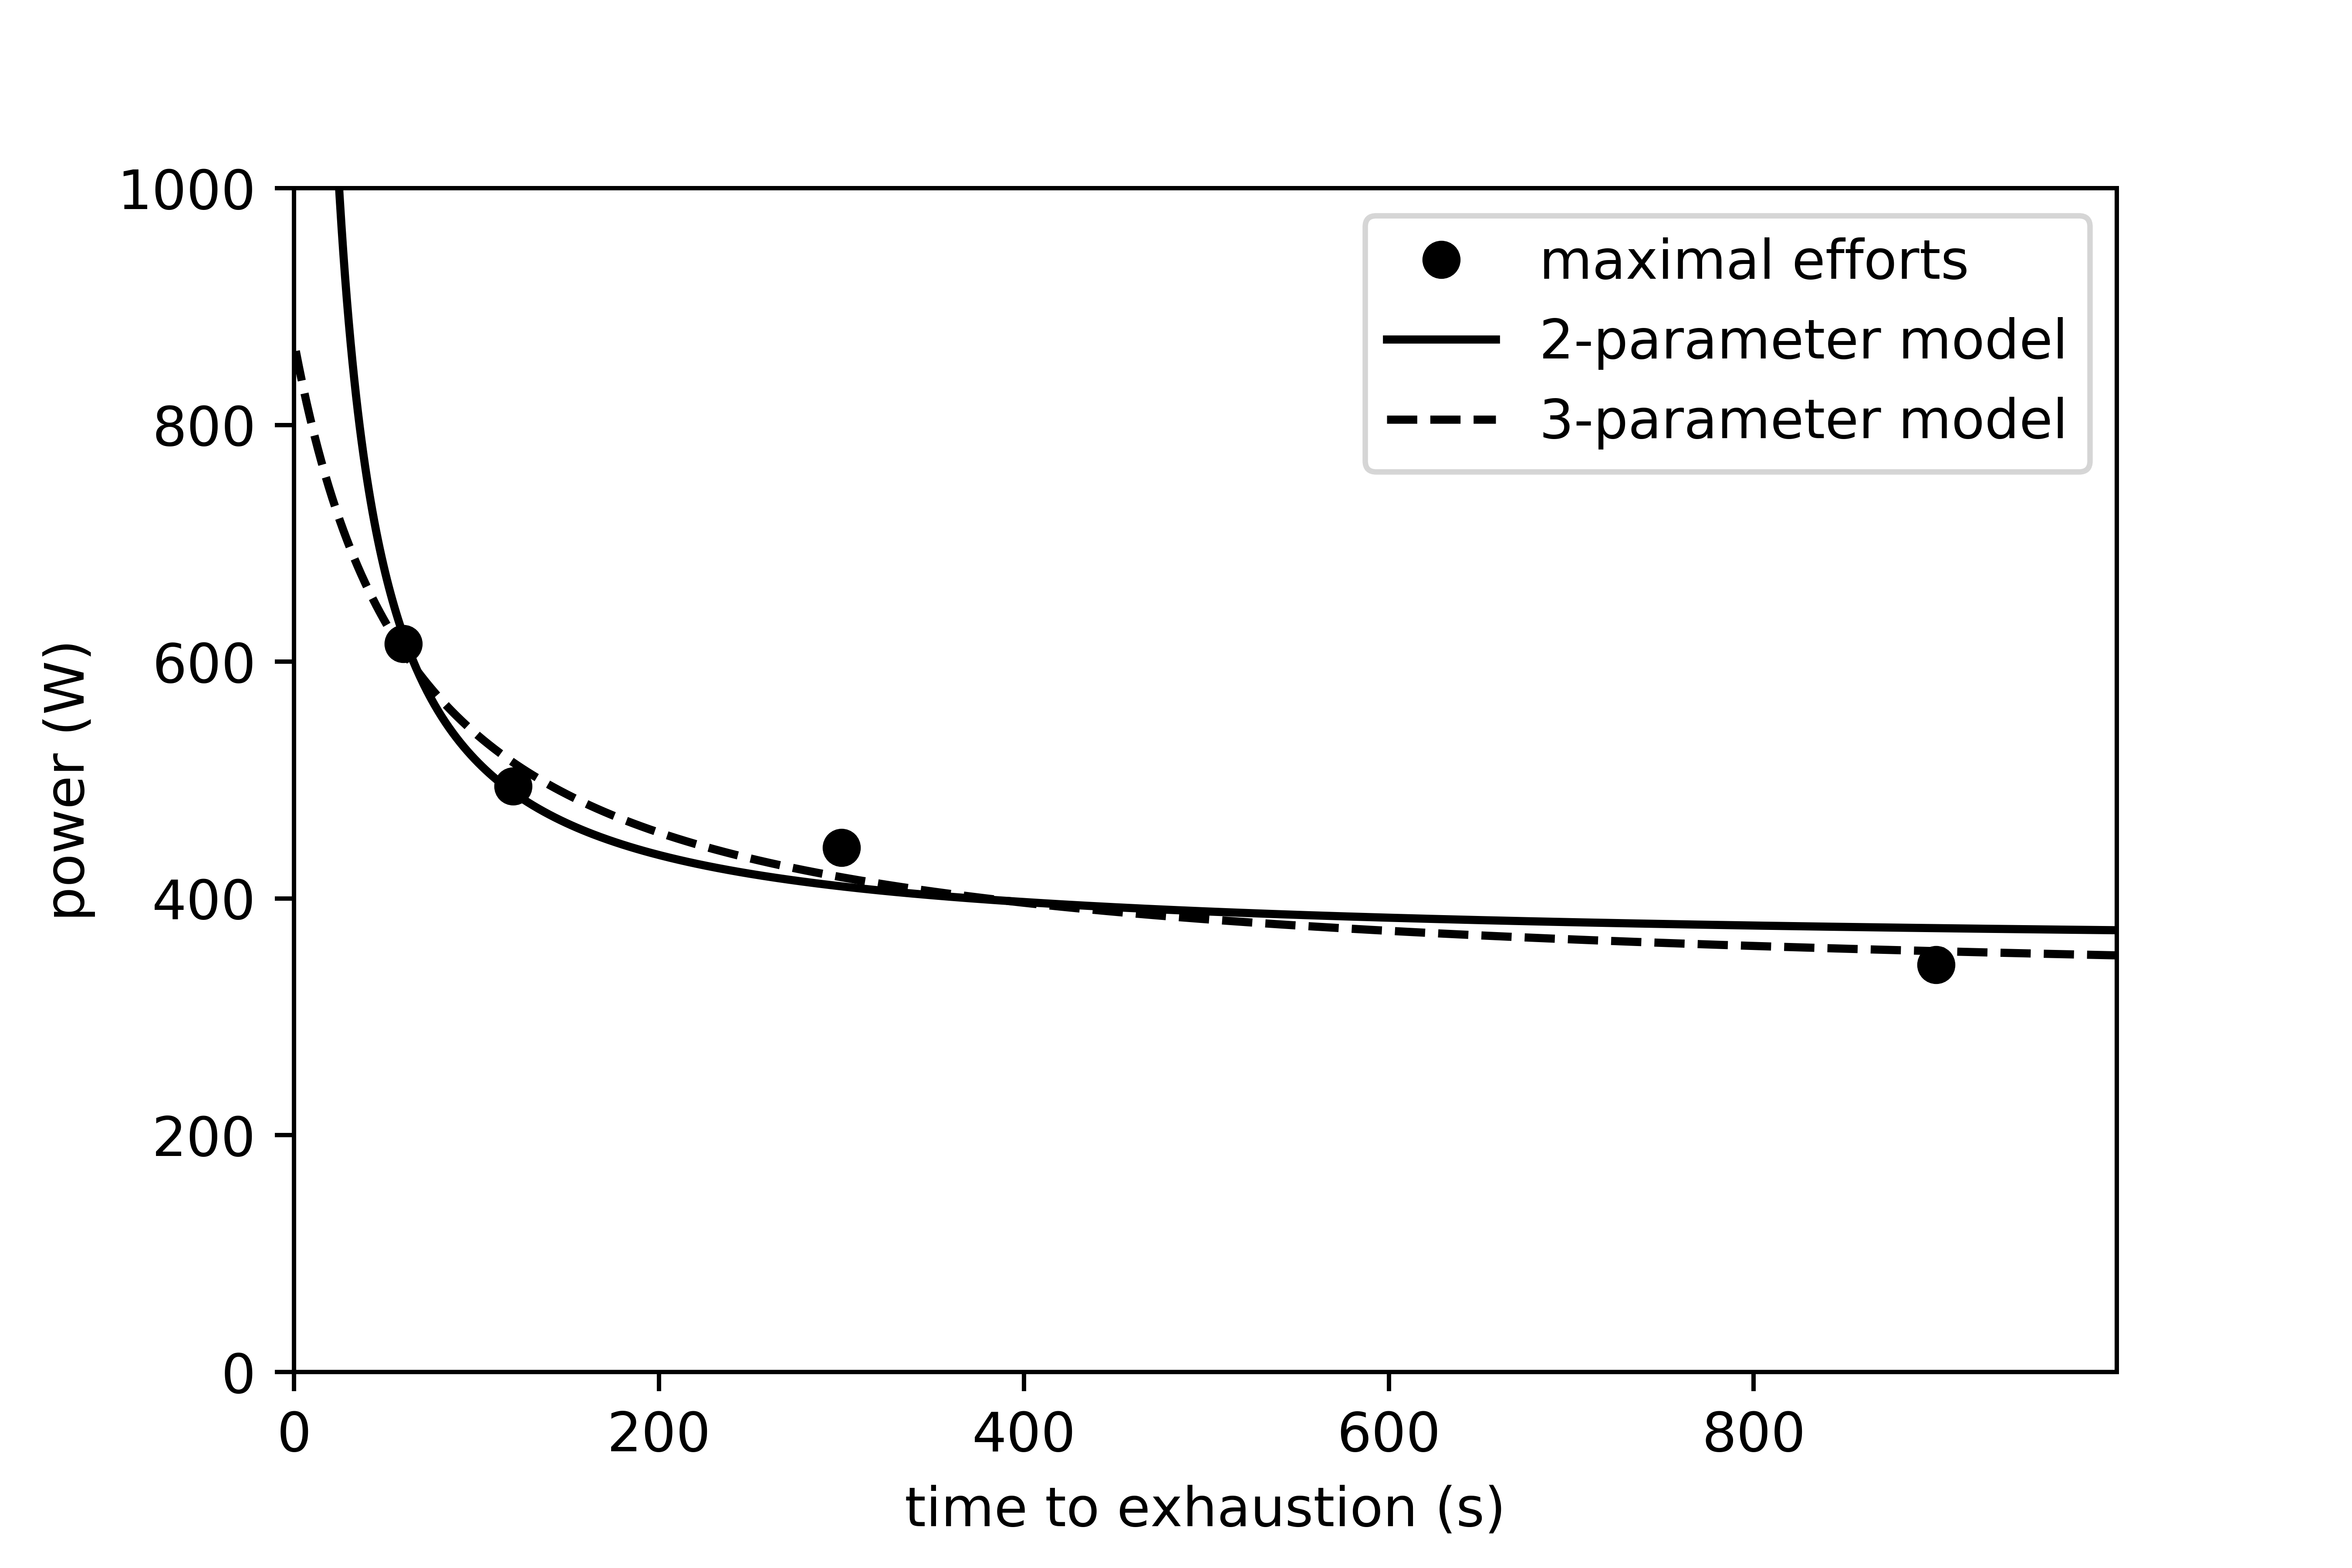
In an ideal world this p_max model parameter would indeed be identical to your maximal power but this greatly depends on the data you are feeding the model. In this case you seem to be feeding the model data from a single workout which will not yield the best results. You will get better results when you only feed it the data from some maximal efforts or your "mean max power" over a longer period of time.
Can you explain what you are trying to achieve?
PS: I have plans to extend and improve this library (I haven't worked on it for a while...) but am considering to remove to WorkoutDataFrame interface because I think it's confusing for some people and is an extra interface for me to maintain.
PS 2: If you have suggestions for this library please let me know.
from sweatpy.
ethanopp
commented on June 14, 2024
Thanks for the response @AartGoossens! Happy to help out with the project once you start it up again. I'm a little new to the statistics portions of all of this, but have enough python experience to code some stuff out once I understand the math...
So ultimately what I am trying to do is build a small personal app that can run the CP model every day on a rolling period (perhaps rolling 90 days) and show me what my CP is every day based on the best efforts from that passed rolling time period. I'm building out my own charts which pull in metrics from a lot of other data sources which golden cheetah does not leverage, however I still want to use the golden cheetah metrics, hence why I am trying to replicate them... Here's an example of a modified PMC which is also incorporating HRV data and readiness scores from my oura ring, as well as non ride/run workouts which leverage HRss or weightlifting "WSS" (which I am calculating on my own), which can all be toggled with the top 3 teal buttons to show activity type specific CTL (fitness), but leverage ATL (fatigue) across all workouts (credits to Elevate app for some of my design choices):

Of course a key function of creating this chart is calculating TSS per workout, which requires an FTP/CP score. Currently I've been doing FTP tests every 6 weeks, but I am trying to move towards a different model wherein I can just auto-calculate my CP for a rolling period (tbd) and not have the FTP Testing days screw up my workout plans...
Since my original post I have tried out a few other tests, with larger date frames, however am still not able to match the numbers to what is showing in Golden Cheetah...
The dataset being tested against is from 01/01/2020 onward, and should match to the model params shown in golden cheetah:


Test 1 (fail):
Query the raw activity stream from strava (which is saved to database) for all workouts starting 01/01/2020 onward, and run compute_mean_max_power() on the dataset, to then pass to the model:
def test_samples():
    session, engine = db_connect()
    df = pd.read_sql(
        sql=session.query(stravaSamples.time.label('time'),
                          stravaSamples.heartrate, stravaSamples.cadence,
                          stravaSamples.velocity_smooth.label('speed'),
                          stravaSamples.watts.label('power')).filter(
            stravaSamples.date >= '2020-01-01'
        ).statement, con=engine)

    wdf = WorkoutDataFrame(df)
    mmp = pd.Series(wdf.compute_mean_max_power(), name='mmp').to_frame()
    # Update time index so it starts at 1 second (instead of 0)
    mmp['time'] = [x for x in range(1, len(mmp) + 1)]
    mmp.set_index('time', inplace=True)

    # Run CP model
    model = '3_parameter_non_linear'
    time_axis = mmp.index
    max_efforts = mmp['mmp']
    fitted_params = critical_power.model_fit(
        time_axis,
        max_efforts,
        model=model)

    print(fitted_params)
{'cp': 183.22516941252542, 'w_prime': 138594.30901078475, 'p_max': 315.0913700735806}
Golden Cheetah CP (247) != Python CP (183)
Test 2 (fail):
Query all workouts from strava, run compute_mean_max_power() on each workout and store those mmp's into a table. Query this table grouped by each interval (seconds) for all workouts after 01/01/2020 and pass to model (only 1 datapoint - the best of the bests- per interval is passed to model here):
def test_best_samples():
    session, engine = db_connect()

    # select max effort group by interval from every workout already stored with compute_mean_max_power()
    mmp = pd.read_sql(
        sql=session.query(func.max(stravaBestSamples.mmp).label('mmp'))
            .group_by(stravaBestSamples.interval.label('time'))
            .filter(stravaBestSamples.date >= '2020-01-01')
            .statement, con=engine)

    # Update time index so it starts at 1 second (instead of 0)
    mmp['time'] = [x for x in range(1, len(mmp) + 1)]
    mmp.set_index('time', inplace=True)

    # Run CP model
    model = '3_parameter_non_linear'
    time_axis = mmp.index
    max_efforts = mmp['mmp']
    fitted_params = critical_power.model_fit(
        time_axis,
        max_efforts,
        model=model)

    print(fitted_params)
{'cp': 189.93118488057303, 'w_prime': 23849.153224166424, 'p_max': 401.0400687869544}
Golden Cheetah CP (247) != Python CP (189)
As you can see, the outputs from the models above are not match what is showing in Golden Cheetah (screenshots above). So I am a little stuck here now, as I'm not sure what data (and how) I should be passing to the models... It is also worth mentioning that I am not defining an Athlete for any of this analysis, as I don't think I need to give it an athletes' defined CP to then run a model to output CP...right? (the whole point of me running this model is to try and have it tell me what my CP is)... From what I can see in the repo tests, it looks like passing the athlete with their defined CP is for some of the other functions like w_bal, which isn't necessarily what I'm going for here.
As a side note, I do have several other modules where your code has helped me so far, specifically with a lot of the "TrainingPeaks" metrics:

So thanks for sharing all of this code in the first place!
from sweatpy.
AartGoossens
commented on June 14, 2024
Really cool screenshots of your app! It is very interesting how you are combining training data and data from Oura.
And the CP model fitting problem is interesting too. And I think the answer lies in which data GC exactly uses for the model fitting:
Firstly, I think GC only uses a subset of your activities when you select "Data to fit: Performance tests". I expect that the other option ("MMP bests") will use all your activities. But I cannot find in the source code (should be somewhere here) what GC uses to recognize/tag performance tests, so I am not 100% sure.
Secondly, the "search interval" settings seems to specify a range of data on which the model is fitted. But, again, I cannot find the exact mechanism in the source code.
Maybe @liversedge can way in on this? Can you give us some pointers to how/where these settings are applied to the model fitting?
Finally (and maybe you are already aware of this, but wanted to mention it just to be sure), GoldenCheetah does not use this library under the hood, so it might very well be possible that you will never get exactly the same results as in GC.
from sweatpy.
 liversedge
commented on June 14, 2024
liversedge
commented on June 14, 2024
In general we do not fit CP models to points beyond 20 minutes as they tend to be submaximal.
In addition we avoid points less than 2 minutes for the CP2 model.
For the CP3 model we do use data less than 2 minutes.
For best results filter out submax (power index really helps here) and perform a least squares fit.
from sweatpy.
liversedge
commented on June 14, 2024
The envelope fit for the extended cp model is complicated, but basically it tries to fit pmax using short duration window and cp using longer duration window and iteratively / brute force fits.
from sweatpy.
ethanopp
commented on June 14, 2024
@AartGoossens thanks for making the connection here with Mark. 1 last question for you, is it accurate for me to be setting the the time index to start at 1, rather than 0? (where I am setting mmp['time'])
@liversedge, what exactly do you mean by filtering out submax? Per your comment about filtering out intervals greater than 20 mins for the CP3 model, I'm getting much closer...
With the following, I am getting a CP3 of 257W, where Golden Cheetah is showing a CP of 253W,
def test_best_samples():
    session, engine = db_connect()
    # select max effort group by interval from every workout already stored with compute_mean_max_power()
    mmp = pd.read_sql(
        sql=session.query(func.max(stravaBestSamples.mmp).label('mmp'))
            .group_by(stravaBestSamples.interval.label('time'))
            .filter(stravaBestSamples.interval <= 1200)
            .statement, con=engine)

    # Update time index so it starts at 1 second (instead of 0)
    mmp['time'] = [x for x in range(1, len(mmp) + 1)]
    mmp.set_index('time', inplace=True)

    # Run CP model
    model = '3_parameter_non_linear'
    time_axis = mmp.index
    max_efforts = mmp['mmp']
    fitted_params = critical_power.model_fit(
        time_axis,
        max_efforts,
        model=model)

    print(fitted_params)
Unfortunately when I run the CP2 though, there's a little more of a gap, with Golden Cheetah showing 261, but the model giving me 280
    mmp = pd.read_sql(
        sql=session.query(func.max(stravaBestSamples.mmp).label('mmp'))
            .group_by(stravaBestSamples.interval.label('time'))
            .filter(stravaBestSamples.interval <= 1200, stravaBestSamples.interval >= 120)
            .statement, con=engine)
from sweatpy.
liversedge
commented on June 14, 2024
In any MMP curve the vast majority of points will not be maximal - unless you go out and do maximal efforts for every duration from 1s - 20mins. You can eyeball this by looking at how bumpy the curve is and also the lack of a definable S shape might also suggest an absence of short maximal efforts.
If you fit to a curve dominated by submax efforts your estimates will bias low.
from sweatpy.
liversedge
commented on June 14, 2024
Filtering out >20mins will reduce low bias as almost noone does truly maximal efforts that long and even if they do they add little to the fit vs the 20 min efforts anyway since the curve is very flat from 20 mins out.
from sweatpy.
ethanopp
commented on June 14, 2024
Ah I see thanks for explaining this - right now it is indeed fitting to ALL data points under 20 mins.
My goal here is to monitor how critical power is changing over time by using a rolling 90 day window to capture all workouts in this period, MMP all of these workouts, and then take the best efforts of each interval in this dataset (under 20 mins right now for the CP3) to feed to the model. My theory was that using a window of this size would allow for a large enough dataset where taking the max of all of these workouts MMPs would inherently filter out submax, but is there a additional way I can identify these submax data points programmatically?
What’s the approach in golden cheetah if no workouts are marked as performance tests and the user is running the model on the “MMP” setting?
Thanks!
from sweatpy.
liversedge
commented on June 14, 2024
In the CP chart you can enable filtering in option, the PDModel.cpp has details on how the estimator works (e.g. truncting >1200s)
from sweatpy.
AartGoossens
commented on June 14, 2024
@AartGoossens thanks for making the connection here with Mark. 1 last question for you, is it accurate for me to be setting the the time index to start at 1, rather than 0? (where I am setting mmp['time'])
Yes that makes sense because your first mmp value is actually your 1s max power.
from sweatpy.
ethanopp
commented on June 14, 2024
Sorry Mark, I'm not sure I understand - which filters?
I found this:
https://github.com/GoldenCheetah/GoldenCheetah/blob/7b659e69d8df1a3a61fffc5e7ac5b76faf435b00/src/Metrics/PDModel.cpp#L112
...Which I believe corresponds to here:

But when I run the following the numbers still aren't matching up:
def test_best_samples():
    session, engine = db_connect()
    query = session.query(stravaBestSamples.interval, func.max(stravaBestSamples.mmp).label('mmp')).group_by(
        stravaBestSamples.interval.label('time')).filter(
        or_(
            and_(stravaBestSamples.interval >= 180, stravaBestSamples.interval <= 240),
            and_(stravaBestSamples.interval >= 600, stravaBestSamples.interval <= 1200))
    ).statement

    mmp = pd.read_sql(sql=query, con=engine)

    # Run CP model
    model = '3_parameter_non_linear'
    time_axis = mmp['interval']
    max_efforts = mmp['mmp']
    fitted_params = critical_power.model_fit(
        time_axis,
        max_efforts,
        model=model)

    print(fitted_params)
Golden Cheetah shows 253 but the model outputs the following:
{'cp': 261.01736771687024, 'w_prime': 8892.956538533888, 'p_max': -437457668.36119807}
from sweatpy.
ethanopp
commented on June 14, 2024
@AartGoossens I'm not sure if it is effecting it, but it looks like the initial parameters do not match up with what is in Golden Cheetah:
https://github.com/GoldenCheetah/sweatpy/blob/master/sweat/pdm/critical_power.py#L98
from sweatpy.
liversedge
commented on June 14, 2024

from sweatpy.
ethanopp
commented on June 14, 2024
Still not following... When selecting 'Filter Unique Bests' its only changing my CP by 1 point...


And when I am running the CP2 it shows data less than 2 mins?

Ultimately I am just trying to figure out what filters need to be put on the data that is fed into the model...and for CP3 when removing intervals less than 1200 seconds (20 mins) it's not matching up, as its showing my critical power as 256 instead of the 252W or 253W above in screenshots
from sweatpy.
liversedge
commented on June 14, 2024
I see- you are trying to replicate the results that gc gives in your own tool.
My best advice is for you to read the source code- I'm not here to read it for you.
from sweatpy.
ethanopp
commented on June 14, 2024
Alright thanks for the help thus far... Really I'm just trying to replicate the results from GC with this sub-repo within GC.
Unfortunately I'm a little new to coding (self-taught and using this to enhance) so have gone through the GC code as best I can, but from what I can tell the query I'm currently running matches with the dataset GC sends to the 3CP model.
The only other difference I was able to find was the initial parameters the two libraries use mentioned above, so hopefully @AartGoossens can take a look once he gets a chance
from sweatpy.
liversedge
commented on June 14, 2024
No probs, I think you are on a bit of a journey- coding, modelling, critical power model and diagnosing modelling errors.
Would recommend familiarising yourself with basic modelling concepts and some of the literature on CP.
The Jones (2010) review of CP is the best paper to read, its excellent and a few others spring to mind. Drop me an email liversedge gmail com and I'll forward you some stuff.
from sweatpy.
Related Issues (13)
- Duplicate of weigthed_average_power() HOT 2
- Discussion: documentation HOT 2
- Using list comprehensions instead of lamda can be shorter HOT 2
- GoldenCheetah OpenData Project compatibility HOT 6
- Add PEP8 checks to automatic builds HOT 4
- Discussion: make 100% test coverage part of automated build checks? HOT 4
- Discussion: input and output argument type casting HOT 2
- Odd results from PowerDurationRegressor(model="2 param") HOT 1
- Discussion: project stucture HOT 7
- Add from_strava(activity_id) method to WDF HOT 11
- Duplicate of mean_max() algorithm HOT 5
- .tcx file: ParseError: XML or text declaration not at start of entity HOT 1
Recommend Projects
-
 React
React
A declarative, efficient, and flexible JavaScript library for building user interfaces.
-
Vue.js
🖖 Vue.js is a progressive, incrementally-adoptable JavaScript framework for building UI on the web.
-
 Typescript
TypeScript is a superset of JavaScript that compiles to clean JavaScript output.
-
TensorFlow
An Open Source Machine Learning Framework for Everyone
-
Django
The Web framework for perfectionists with deadlines.
-
 Laravel
A PHP framework for web artisans
-
D3
Bring data to life with SVG, Canvas and HTML. 📊📈🎉
-
Recommend Topics
-
javascript
JavaScript (JS) is a lightweight interpreted programming language with first-class functions.
-
web
Some thing interesting about web. New door for the world.
-
server
A server is a program made to process requests and deliver data to clients.
-
Machine learning
Machine learning is a way of modeling and interpreting data that allows a piece of software to respond intelligently.
-
Visualization
Some thing interesting about visualization, use data art
-
Game
Some thing interesting about game, make everyone happy.
Recommend Org
-
Facebook
We are working to build community through open source technology. NB: members must have two-factor auth.
-
Microsoft
Open source projects and samples from Microsoft.
-
Google
Google ❤️ Open Source for everyone.
-
Alibaba
Alibaba Open Source for everyone
-
D3
Data-Driven Documents codes.
-
Tencent
China tencent open source team.
from sweatpy.