Comments (14)
 EdgeSync
commented on May 30, 2024
1
EdgeSync
commented on May 30, 2024
1
Could be related to this:
elastic/elasticsearch#45082
Might just be a red herring - and not actually part of the problem.
from dsiem.
 hackdefendr
commented on May 30, 2024
1
hackdefendr
commented on May 30, 2024
1
Should I upgrade to the ELK 7.x branch?
That's the only thing remaining I can think of, as I have just spent the past few hours trying different things, and nothing is working. My logstash plugin created by the plugin tool creates the templates and associates them with indexes. But those indexes are not getting created and populated.
from dsiem.
 mmta
commented on May 30, 2024
mmta
commented on May 30, 2024
You may have two separate issues here: web UI connection to ES, and Dsiem indices not being populated.
For web UI connection to ES, can you open http://localhost:9200 from your browser directly? If not, then you should adjust that address in esconfig.json to point to the actual endpoint address of ES.
For indices not being populated, have you created a Dsiem plugin (i.e. Logstash config) for those firewall logs yet (see here https://github.com/defenxor/dsiem/blob/master/docs/dsiem_plugin.md) ? Also may worth noting that Dsiem will only work against new incoming logs, so those 6 months old logs mentioned above will not be processed.
from dsiem.
hackdefendr
commented on May 30, 2024
Thanks for replying. Yep, I can access elasticsearch via localhost:9200.
# curl -X GET "localhost:9200/_cluster/health?pretty"
{
  "cluster_name" : "my-application",
  "status" : "yellow",
  "timed_out" : false,
  "number_of_nodes" : 1,
  "number_of_data_nodes" : 1,
  "active_primary_shards" : 172,
  "active_shards" : 172,
  "relocating_shards" : 0,
  "initializing_shards" : 0,
  "unassigned_shards" : 170,
  "delayed_unassigned_shards" : 0,
  "number_of_pending_tasks" : 0,
  "number_of_in_flight_fetch" : 0,
  "task_max_waiting_in_queue_millis" : 0,
  "active_shards_percent_as_number" : 50.29239766081871
}
As for the plugin...I stumbled upon that document and attempted to create the plugin, but it keeps giving an error. I started with this to create the config:
./dpluger create -a http://localhost:9200 -i "logstash-*" -n "logstash" -c dpluger_logstash.json
Then I edit the dpluger_logstash.json file and replace all the defaults with proper fields, etc. Then I run dpluger using the config, and it errors out:
# ./dpluger run -c dpluger_logstash.json
2/2 cpus found in 112.1µs: map[0:0 1:1]
Creating plugin (logstash config) for logstash, using ES: http://localhost:9200 and index pattern: logstash-*
2020-02-02T15:39:51.156-0600	INFO	Found ES version 6.8.6
Checking existence of field host... OK
Checking existence of field @timestamp... OK
Checking existence of field host... OK
Checking existence of field ID... OK
Checking existence of field type... OK
Checking existence of field SRC... OK
Checking existence of field SPT... OK
Checking existence of field DST... OK
Checking existence of field DPT... OK
Checking existence of field PROTO... OK
Done creating plugin, now creating TSV for directive auto generation ..
Checking the existence of field ID... Checking the existence of field host.keyword... Checking the existence of field type.keyword... OK
Collecting unique entries for host.keyword and ID on index logstash-* ...
Exiting: Error encountered while running config file: elastic: Error 400 (Bad Request): all shards failed [type=search_phase_execution_exception]
A config is generated, but its probably incomplete. And as one would expect logstash won't start with the config that is generated.
from dsiem.
hackdefendr
commented on May 30, 2024
Ack! Permissions just bit me on that plugin file. Even though the run produced an error, it appears the plugin conf file is complete. Logstash starts up now that I fixed the permissions on the conf file.
I'm seeing in the logstash log at start up that it is creating the templates and connecting to elastic, but I'm not seeing anything in Kibana. I think I may have inadvertently deleted the siem indexes, thinking it would recreate them. I don't see any errors:
[2020-02-02T16:05:08,553][INFO ][logstash.runner          ] Starting Logstash {"logstash.version"=>"6.8.6"}
[2020-02-02T16:05:17,994][INFO ][logstash.pipeline        ] Starting pipeline {:pipeline_id=>"main", "pipeline.workers"=>2, "pipeline.batch.size"=>125, "pipeline.batch.delay"=>50}
[2020-02-02T16:05:18,479][INFO ][logstash.outputs.elasticsearch] Elasticsearch pool URLs updated {:changes=>{:removed=>[], :added=>[http://localhost:9200/]}}
[2020-02-02T16:05:18,696][WARN ][logstash.outputs.elasticsearch] Restored connection to ES instance {:url=>"http://localhost:9200/"}
[2020-02-02T16:05:18,753][INFO ][logstash.outputs.elasticsearch] ES Output version determined {:es_version=>6}
[2020-02-02T16:05:18,756][WARN ][logstash.outputs.elasticsearch] Detected a 6.x and above cluster: the `type` event field won't be used to determine the document _type {:es_version=>6}
[2020-02-02T16:05:18,799][INFO ][logstash.outputs.elasticsearch] New Elasticsearch output {:class=>"LogStash::Outputs::ElasticSearch", :hosts=>["//localhost:9200"]}
[2020-02-02T16:05:18,828][INFO ][logstash.outputs.elasticsearch] Using default mapping template
[2020-02-02T16:05:18,865][INFO ][logstash.outputs.elasticsearch] Attempting to install template {:manage_template=>{"template"=>"logstash-*", "version"=>60001, "settings"=>{"index.refresh_interval"=>"5s"}, "mappings"=>{"_default_"=>{"dynamic_templates"=>[{"message_field"=>{"path_match"=>"message", "match_mapping_type"=>"string", "mapping"=>{"type"=>"text", "norms"=>false}}}, {"string_fields"=>{"match"=>"*", "match_mapping_type"=>"string", "mapping"=>{"type"=>"text", "norms"=>false, "fields"=>{"keyword"=>{"type"=>"keyword", "ignore_above"=>256}}}}}], "properties"=>{"@timestamp"=>{"type"=>"date"}, "@version"=>{"type"=>"keyword"}, "geoip"=>{"dynamic"=>true, "properties"=>{"ip"=>{"type"=>"ip"}, "location"=>{"type"=>"geo_point"}, "latitude"=>{"type"=>"half_float"}, "longitude"=>{"type"=>"half_float"}}}}}}}}
[2020-02-02T16:05:18,869][INFO ][logstash.outputs.elasticsearch] Elasticsearch pool URLs updated {:changes=>{:removed=>[], :added=>[http://localhost:9200/]}}
[2020-02-02T16:05:18,882][WARN ][logstash.outputs.elasticsearch] Restored connection to ES instance {:url=>"http://localhost:9200/"}
[2020-02-02T16:05:18,897][INFO ][logstash.outputs.elasticsearch] ES Output version determined {:es_version=>6}
[2020-02-02T16:05:18,899][WARN ][logstash.outputs.elasticsearch] Detected a 6.x and above cluster: the `type` event field won't be used to determine the document _type {:es_version=>6}
[2020-02-02T16:05:18,907][INFO ][logstash.outputs.elasticsearch] Using mapping template from {:path=>"/etc/logstash/index-template.d/siem_events-template.json"}
[2020-02-02T16:05:18,914][INFO ][logstash.outputs.elasticsearch] New Elasticsearch output {:class=>"LogStash::Outputs::ElasticSearch", :hosts=>["//localhost:9200"]}
[2020-02-02T16:05:18,922][INFO ][logstash.outputs.elasticsearch] Attempting to install template {:manage_template=>{"index_patterns"=>["siem_events-*"], "version"=>1, "settings"=>{"number_of_replicas"=>0, "number_of_shards"=>1, "index.refresh_interval"=>"1s"}, "mappings"=>{"doc"=>{"dynamic_templates"=>[{"strings_as_keywords"=>{"match_mapping_type"=>"string", "mapping"=>{"type"=>"text", "norms"=>false, "fields"=>{"keyword"=>{"type"=>"keyword", "ignore_above"=>256}}}}}], "properties"=>{"src_ip"=>{"type"=>"ip"}, "dst_ip"=>{"type"=>"ip"}}}}}}
[2020-02-02T16:05:18,928][INFO ][logstash.outputs.elasticsearch] Elasticsearch pool URLs updated {:changes=>{:removed=>[], :added=>[http://localhost:9200/]}}
[2020-02-02T16:05:18,940][INFO ][logstash.outputs.elasticsearch] Installing elasticsearch template to _template/siem_events
[2020-02-02T16:05:18,950][WARN ][logstash.outputs.elasticsearch] Restored connection to ES instance {:url=>"http://localhost:9200/"}
[2020-02-02T16:05:18,980][INFO ][logstash.outputs.elasticsearch] ES Output version determined {:es_version=>6}
[2020-02-02T16:05:18,982][WARN ][logstash.outputs.elasticsearch] Detected a 6.x and above cluster: the `type` event field won't be used to determine the document _type {:es_version=>6}
[2020-02-02T16:05:19,116][INFO ][logstash.outputs.elasticsearch] Using mapping template from {:path=>"/etc/logstash/index-template.d/siem_alarm_events-template.json"}
[2020-02-02T16:05:19,123][INFO ][logstash.outputs.elasticsearch] New Elasticsearch output {:class=>"LogStash::Outputs::ElasticSearch", :hosts=>["//localhost:9200"]}
[2020-02-02T16:05:19,128][INFO ][logstash.outputs.elasticsearch] Attempting to install template {:manage_template=>{"index_patterns"=>["siem_alarm_events-*"], "version"=>1, "settings"=>{"number_of_replicas"=>0, "number_of_shards"=>1, "index.refresh_interval"=>"1s"}, "mappings"=>{"doc"=>{"dynamic_templates"=>[{"strings_as_keywords"=>{"match_mapping_type"=>"string", "mapping"=>{"type"=>"text", "norms"=>false, "fields"=>{"keyword"=>{"type"=>"keyword", "ignore_above"=>256}}}}}]}}}}
[2020-02-02T16:05:19,144][INFO ][logstash.outputs.elasticsearch] Elasticsearch pool URLs updated {:changes=>{:removed=>[], :added=>[http://localhost:9200/]}}
[2020-02-02T16:05:19,146][INFO ][logstash.outputs.elasticsearch] Installing elasticsearch template to _template/siem_alarm_events
[2020-02-02T16:05:19,155][WARN ][logstash.outputs.elasticsearch] Restored connection to ES instance {:url=>"http://localhost:9200/"}
[2020-02-02T16:05:19,172][INFO ][logstash.outputs.elasticsearch] ES Output version determined {:es_version=>6}
[2020-02-02T16:05:19,174][WARN ][logstash.outputs.elasticsearch] Detected a 6.x and above cluster: the `type` event field won't be used to determine the document _type {:es_version=>6}
[2020-02-02T16:05:19,177][INFO ][logstash.outputs.elasticsearch] Using mapping template from {:path=>"/etc/logstash/index-template.d/siem_alarms-template.json"}
[2020-02-02T16:05:19,180][INFO ][logstash.outputs.elasticsearch] New Elasticsearch output {:class=>"LogStash::Outputs::ElasticSearch", :hosts=>["//localhost:9200"]}
[2020-02-02T16:05:19,192][INFO ][logstash.outputs.elasticsearch] Attempting to install template {:manage_template=>{"index_patterns"=>["siem_alarms-*"], "version"=>1, "settings"=>{"number_of_replicas"=>0, "number_of_shards"=>1, "index.refresh_interval"=>"1s"}, "aliases"=>{"siem_alarms"=>{}, "siem_alarms_id_lookup"=>{}}, "mappings"=>{"doc"=>{"dynamic_templates"=>[{"strings_as_keywords"=>{"match_mapping_type"=>"string", "mapping"=>{"type"=>"text", "norms"=>false, "fields"=>{"keyword"=>{"type"=>"keyword", "ignore_above"=>256}}}}}], "properties"=>{"src_ips"=>{"type"=>"ip"}, "dst_ips"=>{"type"=>"ip"}}}}}}
[2020-02-02T16:05:19,222][INFO ][logstash.outputs.elasticsearch] Installing elasticsearch template to _template/siem_alarms
[2020-02-02T16:05:19,261][INFO ][logstash.filters.geoip   ] Using geoip database {:path=>"/etc/logstash/GeoLite2-City.mmdb"}
[2020-02-02T16:05:19,464][INFO ][logstash.filters.elasticsearch] New ElasticSearch filter client {:hosts=>["localhost:9200"]}
[2020-02-02T16:05:19,975][INFO ][logstash.inputs.file     ] No sincedb_path set, generating one based on the "path" setting {:sincedb_path=>"/var/lib/logstash/plugins/inputs/file/.sincedb_b4c2c45f7ee39f6bea1903f18609de08", :path=>["/var/log/firewall.log"]}
[2020-02-02T16:05:20,000][INFO ][logstash.pipeline        ] Pipeline started successfully {:pipeline_id=>"main", :thread=>"#<Thread:0x5a42a5ee run>"}
[2020-02-02T16:05:20,061][INFO ][logstash.agent           ] Pipelines running {:count=>1, :running_pipelines=>[:main], :non_running_pipelines=>[]}
[2020-02-02T16:05:20,096][INFO ][filewatch.observingtail  ] START, creating Discoverer, Watch with file and sincedb collections
[2020-02-02T16:05:20,647][INFO ][logstash.agent           ] Successfully started Logstash API endpoint {:port=>9600}
from dsiem.
hackdefendr
commented on May 30, 2024
So is there a way for me to undo everything and start fresh with dsiem? Because it seems that after the initial index creation, I can't get them recreated. Logstash says in the logs that outputs are created, and connections are restored, but I'm just not seeing it the data.
This error during the plugin creation tells me there might be an issue with elasticsearch.
Exiting: Error encountered while running config file: elastic: Error 400 (Bad Request): all shards failed [type=search_phase_execution_exception]
from dsiem.
EdgeSync
commented on May 30, 2024
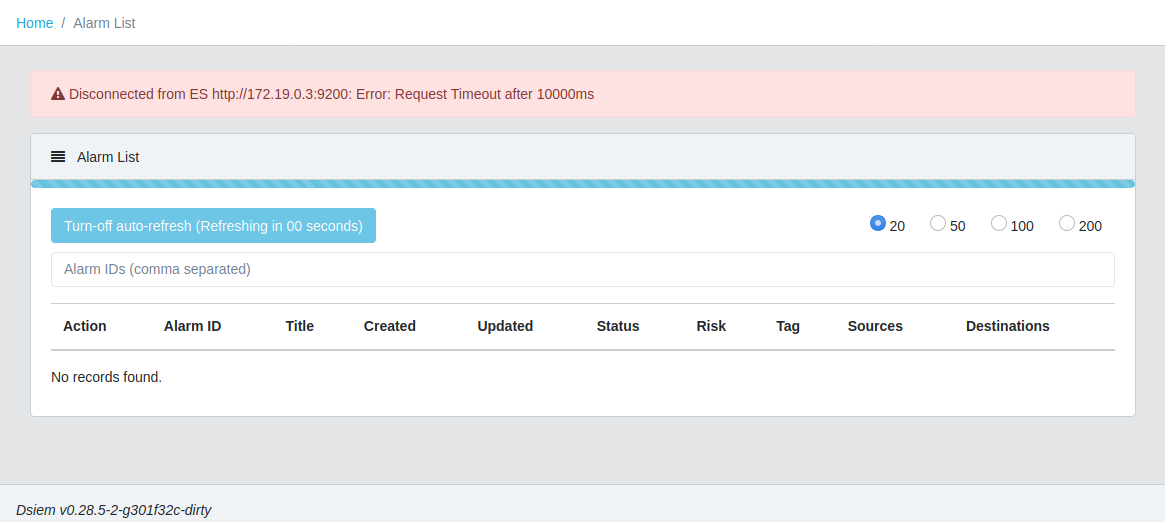
Just wanted to chime in an say I too am experiencing the issue with "No Living Connections".
When I go to http://localhost:8080/ui/, The error is there.
I can go to http://localhost:8080/ui/assets/config/esconfig.json, and see the config:
{
"elasticsearch": "http://elastic:\<somepasshere>@localhost:9200",
"kibana": "https://localhost:5601"
}
And i can access elastic fine via the user:password@url:port combination:
http://elastic:\<somepasshere>@localhost:9200
{
"name" : "Watcher",
"cluster_name" : "elasticsearch",
"cluster_uuid" : "6WNDiEYHRa2fqYnb7vDzDA",
"version" : {
"number" : "7.6.0",
"build_flavor" : "default",
"build_type" : "deb",
"build_hash" : "7f634e9f44834fbc12724506cc1da681b0c3b1e3",
"build_date" : "2020-02-06T00:09:00.449973Z",
"build_snapshot" : false,
"lucene_version" : "8.4.0",
"minimum_wire_compatibility_version" : "6.8.0",
"minimum_index_compatibility_version" : "6.0.0-beta1"
},
"tagline" : "You Know, for Search"
}
Still trying to troubleshoot, but not any closer to figuring it out.
from dsiem.
hackdefendr
commented on May 30, 2024
I have exhausted all my abilities at this and have gotten nowhere. The only conclusion is something changed with Elasticsearch 6.8.6 and it no longer accepts or recognizes connections from dsiem.
The hint came when I created my plugin and got a Error 400 Bad Request.
from dsiem.
EdgeSync
commented on May 30, 2024
Okay I was able to fix it - I re-read through the FAQ for DSIEM, and realised I had never done the CORS configuration in my Elasticsearch.yml file.
However their documentation appears incorrect for newer version of elasticsearch (I am using 7.6.0)
https://github.com/defenxor/dsiem/blob/master/docs/faq.md
This is the configuration I had to use:
http.cors.enabled: true
http.cors.allow-credentials: true
http.cors.allow-origin: "*"
http.cors.allow-headers: Authorization,X-Requested-With,Content-Type,Content-Length
Just drop it anywhere in elasticsearch.yml
from dsiem.
hackdefendr
commented on May 30, 2024
I am not having the same luck. ELK services all start, and dsiem starts, but I still get No Living Connections. I have restarted everything, and rebooted. It won't recreate the indexes it needs.
from dsiem.
EdgeSync
commented on May 30, 2024
Not sure if this is how it's supposed to be, but my indexes didn't appear until I was successfully sending logs to elastic. This was irrespective of the "No Living Connections" error on the DSIEM web portal.
Once I had added additional configurations to the log files for filebeat and logstash (to negotiate SSL) I ran dtester, and generated some test data, and my indexes showed up straight away.
In my case I had to sit and study the flow of the events, starting and stopping services, and watching the responses in /var/log/syslog, and understand where the failure was. Sorry I can't be of more help than that.
from dsiem.
hackdefendr
commented on May 30, 2024
Hmm, I'm definitely sending logs to elastic via logstash via firewall syslog. I'm only using logstash, not filebeat. The first time I fired up dsiem some indexes were created, but I tried to delete everything and start over, and now I can't get it to talk. That Error 400 Bad Request is still bothering me.
I will open up screen and start tailing logs while I restart services to see if I can spot problems. Maybe you're right and there's that one line with the answer.
Maybe I will retry creating my dsiem plugin again.
Does this mean anything to anyone? My elasticsearch application log is filled with this message.
[2020-02-22T19:37:27,365][DEBUG][o.e.a.s.TransportSearchAction] [node-1] All shards failed for phase: [query]
[2020-02-22T19:37:27,365][WARN ][r.suppressed             ] [node-1] path: /.kibana_task_manager/_doc/_search, params: {ignore_unavailable=true, index=.kibana_task_manager, type=_doc}
org.elasticsearch.action.search.SearchPhaseExecutionException: all shards failed
        at org.elasticsearch.action.search.AbstractSearchAsyncAction.onPhaseFailure(AbstractSearchAsyncAction.java:296) [elasticsearch-6.8.6.jar:6.8.6]
        at org.elasticsearch.action.search.AbstractSearchAsyncAction.executeNextPhase(AbstractSearchAsyncAction.java:133) [elasticsearch-6.8.6.jar:6.8.6]
        at org.elasticsearch.action.search.AbstractSearchAsyncAction.onPhaseDone(AbstractSearchAsyncAction.java:259) [elasticsearch-6.8.6.jar:6.8.6]
        at org.elasticsearch.action.search.InitialSearchPhase.onShardFailure(InitialSearchPhase.java:100) [elasticsearch-6.8.6.jar:6.8.6]
        at org.elasticsearch.action.search.InitialSearchPhase.lambda$performPhaseOnShard$1(InitialSearchPhase.java:208) [elasticsearch-6.8.6.jar:6.8.6]
        at org.elasticsearch.action.search.InitialSearchPhase$1.doRun(InitialSearchPhase.java:187) [elasticsearch-6.8.6.jar:6.8.6]
        at org.elasticsearch.common.util.concurrent.AbstractRunnable.run(AbstractRunnable.java:37) [elasticsearch-6.8.6.jar:6.8.6]
        at org.elasticsearch.common.util.concurrent.TimedRunnable.doRun(TimedRunnable.java:41) [elasticsearch-6.8.6.jar:6.8.6]
        at org.elasticsearch.common.util.concurrent.ThreadContext$ContextPreservingAbstractRunnable.doRun(ThreadContext.java:751) [elasticsearch-6.8.6.jar:6.8.6]
        at org.elasticsearch.common.util.concurrent.AbstractRunnable.run(AbstractRunnable.java:37) [elasticsearch-6.8.6.jar:6.8.6]
        at java.util.concurrent.ThreadPoolExecutor.runWorker(ThreadPoolExecutor.java:1128) [?:?]
        at java.util.concurrent.ThreadPoolExecutor$Worker.run(ThreadPoolExecutor.java:628) [?:?]
        at java.lang.Thread.run(Thread.java:834) [?:?]
from dsiem.
 ridhadabbous
commented on May 30, 2024
ridhadabbous
commented on May 30, 2024
Same problem, when I try to deploy the 'demo' with the 'run. sh' script and also with the 'compose file' , I verify the IP configuration no thing look odd :/
from dsiem.
ridhadabbous
commented on May 30, 2024
fixed with the some configuration in my local machine .
the problem occur when i deploy it in the cloud ....
from dsiem.
Related Issues (20)
- Can DSIEM hava a webhook configuration? HOT 2
- Dsiem-Tools HOT 1
- [Question] Using Dsiem without ELK
- why doesn't dsiem accept logs? HOT 1
- CustomData problem HOT 1
- [Feature Request] Accept json array in POST /events route HOT 1
- CustomData special
- [Question] Reload directives HOT 1
- !:1 usage
- Unable to send events from Logstash to Dsiem HOT 2
- linux/arm64 server build HOT 1
- Order Independent "AND" for Directives? HOT 1
- How to set directives HOT 3
- 404 error when running demo HOT 1
- Unable to see siem_alarms in Kibana and Dsiem HOT 1
- esconfig.json HOT 1
- One stage rule
- Disconnected from ES http://elasticsearch:9200: Error: No Living connections HOT 2
- Disconnected from ES http://:9200: Error: No Living connection HOT 2
- Error while getting firewall logs to DSIEM and Kibana Dashboard HOT 1
Recommend Projects
-
 React
React
A declarative, efficient, and flexible JavaScript library for building user interfaces.
-
Vue.js
🖖 Vue.js is a progressive, incrementally-adoptable JavaScript framework for building UI on the web.
-
 Typescript
TypeScript is a superset of JavaScript that compiles to clean JavaScript output.
-
TensorFlow
An Open Source Machine Learning Framework for Everyone
-
Django
The Web framework for perfectionists with deadlines.
-
 Laravel
A PHP framework for web artisans
-
D3
Bring data to life with SVG, Canvas and HTML. 📊📈🎉
-
Recommend Topics
-
javascript
JavaScript (JS) is a lightweight interpreted programming language with first-class functions.
-
web
Some thing interesting about web. New door for the world.
-
server
A server is a program made to process requests and deliver data to clients.
-
Machine learning
Machine learning is a way of modeling and interpreting data that allows a piece of software to respond intelligently.
-
Visualization
Some thing interesting about visualization, use data art
-
Game
Some thing interesting about game, make everyone happy.
Recommend Org
-
Facebook
We are working to build community through open source technology. NB: members must have two-factor auth.
-
Microsoft
Open source projects and samples from Microsoft.
-
Google
Google ❤️ Open Source for everyone.
-
Alibaba
Alibaba Open Source for everyone
-
D3
Data-Driven Documents codes.
-
Tencent
China tencent open source team.
from dsiem.