Comments (2)
 TomNicholas
commented on August 26, 2024
TomNicholas
commented on August 26, 2024
So I've been doing some reading, and I think we should strive to emulate something like this example from the xarray documentation, which uses cartopy to project data onto a globe, then plots it with matplotlib:
import cartopy.crs as ccrs

air = xr.tutorial.open_dataset('air_temperature').air

ax = plt.axes(projection=ccrs.Orthographic(-80, 35))

air.isel(time=0).plot.contourf(ax=ax, transform=ccrs.PlateCarree());

ax.set_global(); ax.coastlines();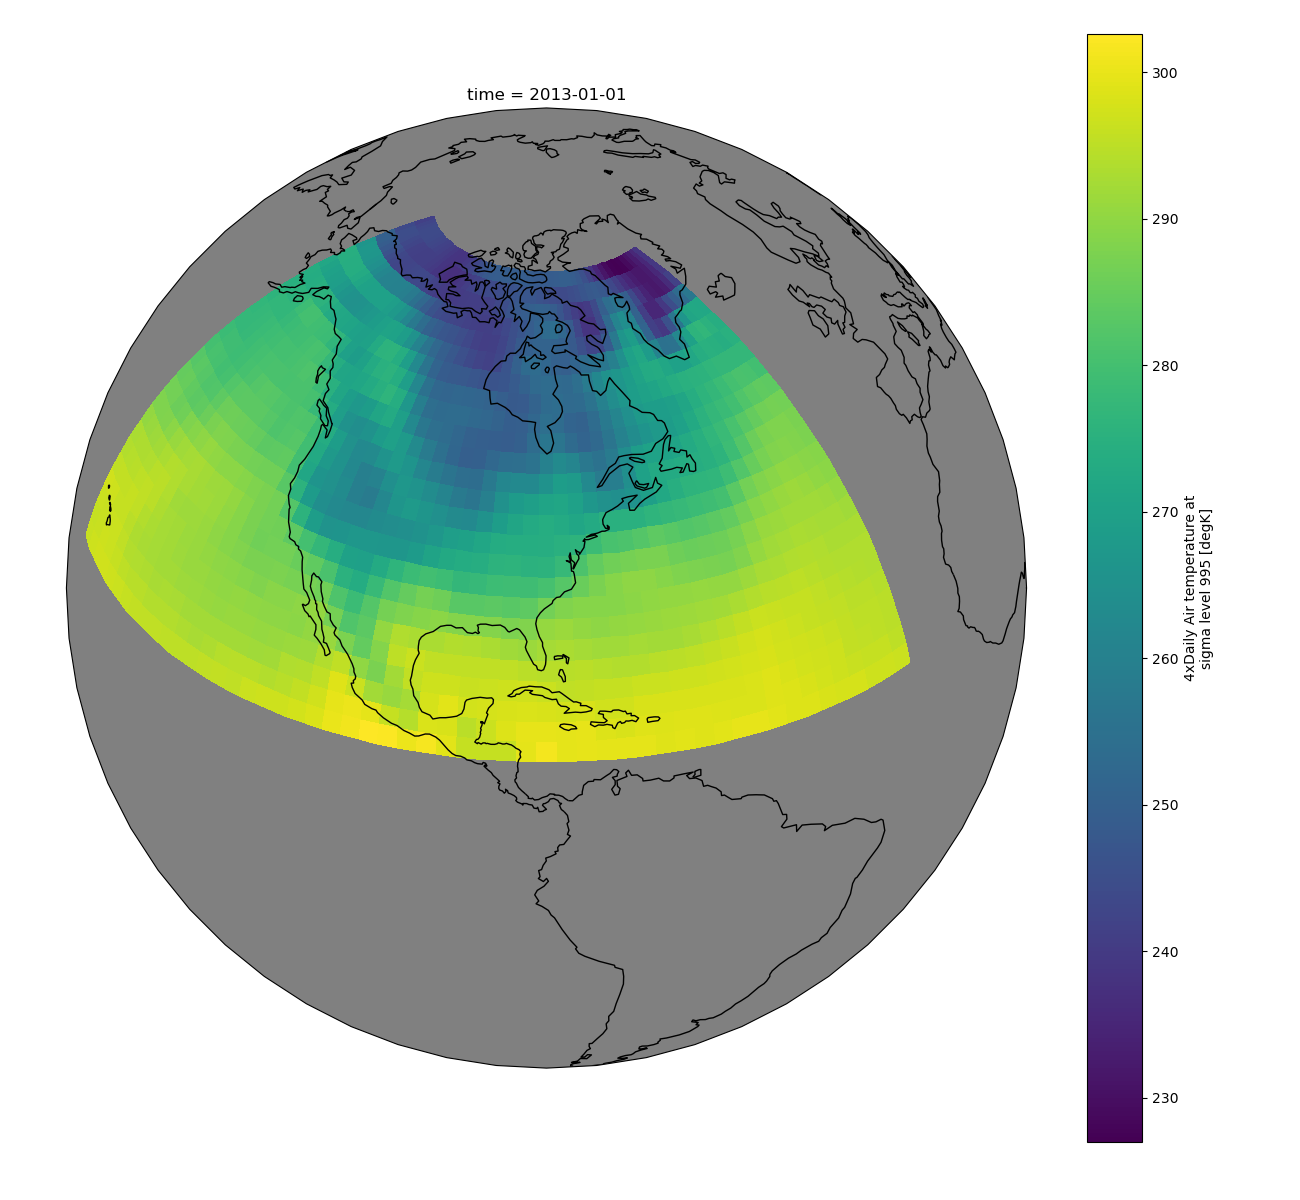
There are several advantages of this approach:
-
The projection is passed to matplotlib in the way the matplotlib developers intended, no hacks needed.
-
There is a clear way to implement and specify common projections, e.g.
ax = plt.axes(projection="poloidal_slice")`
-
The projection and axes are implemented by a completely separate module from the data handling. xarray is not actually required here.
-
If people want to add new projections then they just add to that module. Different geometries could be handled in a number of ways, one method might look like:
from cartomak.geometries import axisymmetric as cga

ax = plt.axes(projection=cga.PoloidalSlice())`
Also if you just want to plot your raw data on a rectangular grid then you simply don't supply any projection and you'll get a rectangular plot as normal.
-
Both the projection and the transform can take arguments. Although the shape of the Earth doesn't vary, the shape of our plasma does, so being able to alter the transformation based on our data (e.g.
grid.ncfile,geqdskfile...) is important. -
The above example adds coastlines to the globe - we could use a similar method to add separatrices:
ax.separatrices()
Adding vessel wall positions would be more complex but possible using an approach like this, e.g.
import cartomak.feature as ctf

ax.add_feature(ctf.VESSEL, machine='MAST')
This could possibly take from existing libraries which can read and plot vessel geometries in matplotlib (@nick-walkden how does pyEquilibrium do it?)
-
The cartopy model doesn't tie you in to using matplotlib. They provide matplotlib compatibility through the projection classes but the underlying transforms can be used with other plotting libraries - here are some examples of cartopy being used with bokeh instead.
-
I'm pretty sure this should be compatible with animating the plots into gifs using animatplot.
-
I tagged this as requiring BOUT changes, but I'm not sure it does. The dataset you plot will need xarray
coordsadded, and these will have to match some standard forms (corresponding to different geometries) in order to be interpreted. However I think this could be done entirely by BOUT-module-specific post-processing code in python, e.g. a side-effect ofopen_stormdataset(which inherits fromxbout.open_boutdataset) is to calculate and add the coordinates['radial', 'pol', 'tor'].
So basically I think that eventually xBOUT should have a module (or maybe it could be standalone project...) which is basically cartopy for tokamaks (cartomak??)
@ZedThree @d7919 @bendudson @JosephThomasParker @johnomotani thoughts?
from xbout.
TomNicholas
commented on August 26, 2024
While my general grand vision above is another matter, I think that the aim of plotting bout-specific geometries has been fulfilled by #34 and #50 , so I'm going to close this.
from xbout.
Related Issues (20)
- Should `BoutDataset.save()` record the version of `xBOUT` used to produce the files? HOT 6
- bout.pcolormesh usage HOT 1
- CI: Update actions HOT 1
- Restart created from dmp* files not working HOT 6
- Question about analysis methods HOT 1
- Better intro for new users in docs
- Kerchunk to create a virtual Zarr store
- xarray - compatibility with latest versions HOT 5
- xarray cacheing NetCDF files HOT 1
- Tests fail with Matplotlib 3.7 HOT 1
- Deprecated installation of tests HOT 5
- Inconsistency in reading cell dimension variables HOT 2
- Docs are failing to build PDFs HOT 5
- Broken links in docs
- da.bout.pcolormesh docs very sparse HOT 1
- xbout datasets cannot be stored HOT 1
- `setuptools_scm_git_archive` is obsolete since setuptools_scm version 7
- Missing files give an error of "Do not know how to read file extension" HOT 1
- CI test failure HOT 1
- Implement evaluate_at for FCI
Recommend Projects
-
 React
React
A declarative, efficient, and flexible JavaScript library for building user interfaces.
-
Vue.js
🖖 Vue.js is a progressive, incrementally-adoptable JavaScript framework for building UI on the web.
-
 Typescript
TypeScript is a superset of JavaScript that compiles to clean JavaScript output.
-
TensorFlow
An Open Source Machine Learning Framework for Everyone
-
Django
The Web framework for perfectionists with deadlines.
-
 Laravel
A PHP framework for web artisans
-
D3
Bring data to life with SVG, Canvas and HTML. 📊📈🎉
-
Recommend Topics
-
javascript
JavaScript (JS) is a lightweight interpreted programming language with first-class functions.
-
web
Some thing interesting about web. New door for the world.
-
server
A server is a program made to process requests and deliver data to clients.
-
Machine learning
Machine learning is a way of modeling and interpreting data that allows a piece of software to respond intelligently.
-
Visualization
Some thing interesting about visualization, use data art
-
Game
Some thing interesting about game, make everyone happy.
Recommend Org
-
Facebook
We are working to build community through open source technology. NB: members must have two-factor auth.
-
Microsoft
Open source projects and samples from Microsoft.
-
Google
Google ❤️ Open Source for everyone.
-
Alibaba
Alibaba Open Source for everyone
-
D3
Data-Driven Documents codes.
-
Tencent
China tencent open source team.
from xbout.